Toru Kimura@shutterstock
Highlights
- In the first week of May 2023, Galan Lithium announced a resource upgrade for its HMW project.
- On a weekly basis, the stock is up nearly 16%.
- Despite last week's gains, GLN is down nearly 27.2% and 12.70%, respectively, in the last six months and one year.
Galan Lithium Limited (ASX: GLN) shares saw a major up move last week after an announcement from ASX-listed lithium player Allkem (ASX: AKE) and Livent Corp (NYSE: LTHM) said they would merge to create a mega lithium company having a market capitalisation of nearly USD 10.6 billion. If the proposed merger gets regulatory approval, Allkem would own 56% of the merged entity, while Livent would hold the remaining 44% stake in the merged entity.
Worth mentioning here is that both Allkem and Livent have projects in Argentina. Galan also has two lithium projects in Argentina, near the projects of Allkem and Livent. This has probably led to buying in GLN shares, which rose nearly 22% on the day of the above announcement, on 11 May 2023. On a weekly basis, the stock is up nearly 16%.
In the first week of this month, Galan Lithium announced a resource upgrade for its HMW project; it increased the total resource at the project to 6.6 million tonnes of lithium carbonate equivalent at 880mg/l Li. Since March 2020, this was the third major resource upgrade announced by the company.
On Monday, GLN shares ended 0.836% higher at AUD 1.205. Despite last week's gains, GLN is down nearly 27.2% and 12.70%, respectively, in the last six months and one year. Will GLN shares sustain their recent gains and move further from here on? Let's study the price chart of the stock to get an insight into its near-term movement.
GLN’s Technical Analysis:
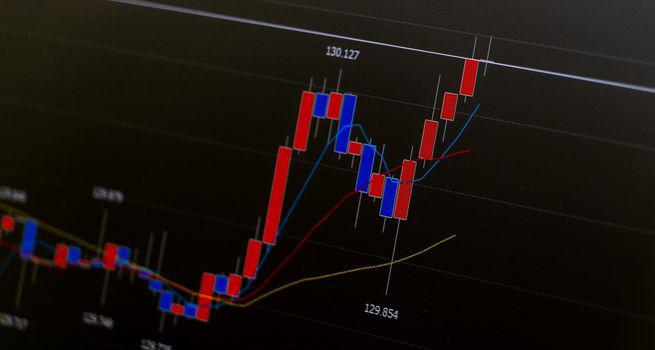
On the weekly chart, GLN’s share price is sustaining above the falling trendline support level, indicating the possibility of an upside movement. Since then, prices are continuously sustaining above the trendline support zone, suggesting the possibility of a further upside hereon. The stock may face resistance at AUD 1.370 level on the upside.
Weekly Technical Chart – GLN

On the weekly chart, RSI (14-period) is moving above the midpoint and showing a reading of ~52.44 level, indicating positive price momentum. Volume analysis shows a positive signal for stock prices. The CMP is moving above the trend following indicators 21-period SMA, further supporting the positive momentum.
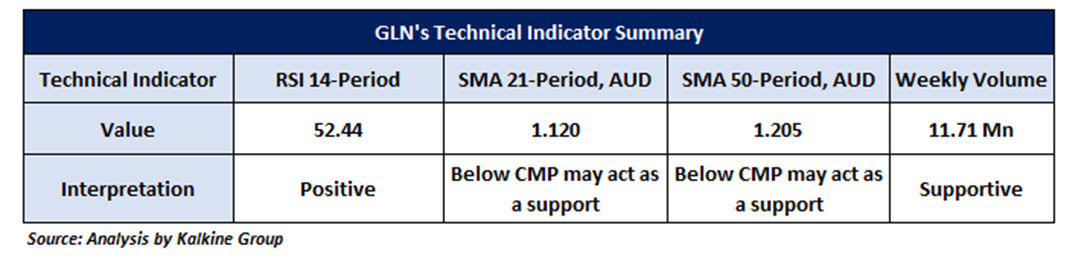
The technical levels for the stock were evaluated as per the closing market price of AUD 1.205 per share, up 0.836%, as of 15 May 2023.
Note 1: Past performance is neither an Indicator nor a guarantee of future performance.
Technical Indicators Defined:
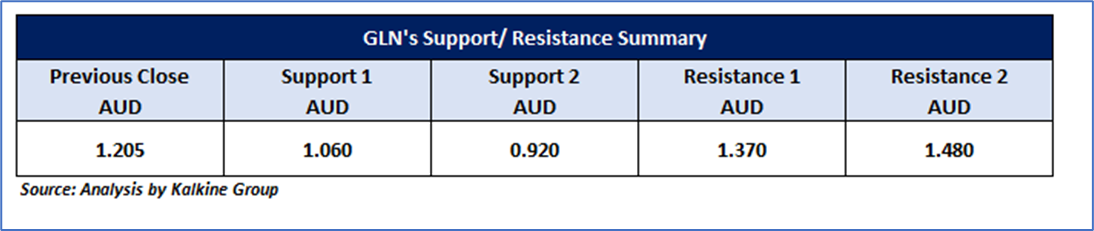
Support: A level at which the stock prices tend to find support if they are falling, and a downtrend may take a pause backed by demand or buying interest. Support 1 refers to the nearby support level for the stock, and if the price breaches the level, then Support 2 may act as the crucial support level for the stock.
Resistance: A level at which the stock prices tend to find resistance when they are rising, and an uptrend may take a pause due to profit booking or selling interest. Resistance 1 refers to the nearby resistance level for the stock and if the price surpasses the level, then Resistance 2 may act as the crucial resistance level for the stock.
Stop-loss: It is a level to protect further losses in case of unfavourable movement in the stock prices.
The Green colour line reflects the 21-period moving average. SMA helps to identify existing price trends. If the prices are trading above the 21-period, prices are currently in a bullish trend (Vice – Versa).
The Blue colour line reflects the 50-period moving average. SMA helps to identify existing price trends. If the prices are trading above the 50-period, prices are currently in a bullish trend (Vice – Versa).
The Orange/ Yellow colour line represents the Trendline.
The Purple colour line in the chart's lower segment reflects the Relative Strength Index (14-Period), which indicates price momentum and signals momentum in trend. A reading of 70 or above suggests overbought status, while a reading of 30 or below suggests an oversold status.

_03_16_2026_07_57_11_233658.jpg)


 Please wait processing your request...