
Another77 @shutterstock
Highlights
- Codrus Minerals Limited (ASX: CDR) shares are up nearly 20% in one week.
- On 5 May 2023, CDR shares rallied 20% after the announcement of its assay results from its first drill hole in the Karloning REE-Niobium Project.
- On Monday, the stock gained over 3%, taking its 3-month gains to 72.41%.
Gold-focused explorer Codrus Minerals Limited (ASX: CDR) ended 3.33% higher at AUD 0.155 on Monday, 8 May 2023, extending last week's gains. On Friday, CDR shares rallied 20% after the company announced assay results from its first drill hole in the Karloning REE-Niobium Project in WA.
As per the announcement, CDR's maiden drill program at its Karloning REE-Niobium Project, which was acquired in November last year, intersected a significant zone of mineralisation, containing high-grade clay-hosted rare earth element (REE). The drilling program, which was aimed at confirming the project’s credentials as a growth and diversification opportunity for the company in the rare earths sector, returned a high-grade intercept of 12m grading 2,680ppm TREYO1 including 4m grading 4,764ppm TREYO.
All the samples received from the drilling program have been submitted to the laboratory for further analysis and the company is currently assimilating the geological data received to date and refining the geological context for the remaining drill-holes for which analysis is yet to come.
For the uninitiated, Codrus entered into a joint venture agreement in November 2022, with Talgomine Minerals Pty Ltd to get 90% interest in the Karloning Project. The company has also pegged an additional tenement adjacent to this project in its own right.
With Monday's gains, CDR shares are now up nearly 20% in one week and over 72% in the last three months. Will CDR shares be able to continue its recent performance in the near term? To know this let's study the price chart of the company.
CDR’s Technical Analysis:
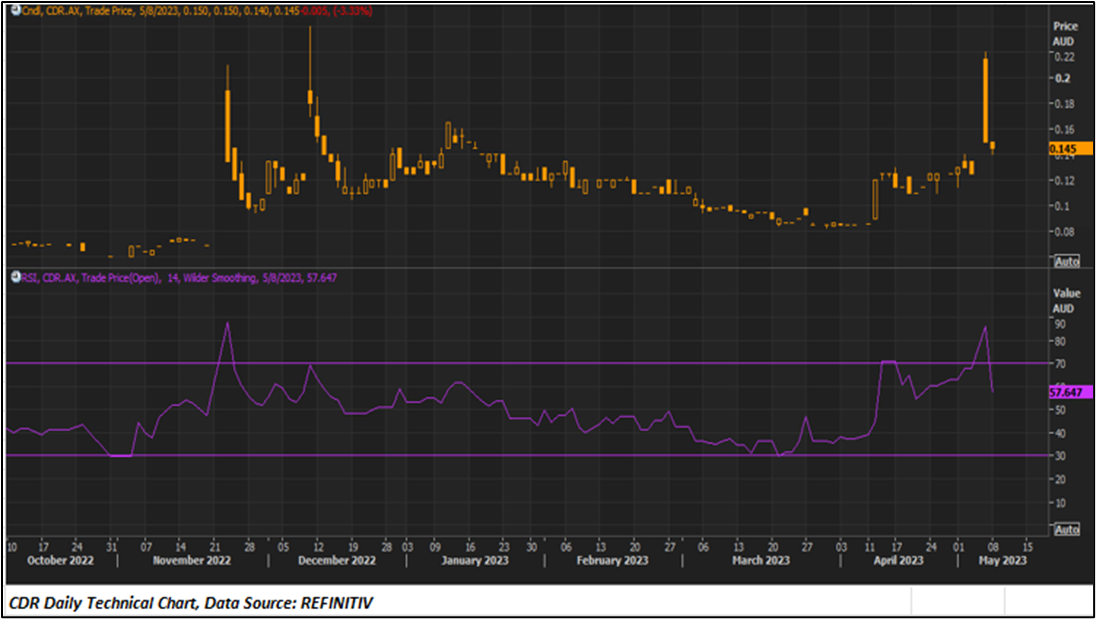
CDR’s price started to move upside after taking the support from a horizontal trendline and recently surpassed the 21-period and 50-period SMA, indicating the possibility of further upside movement hereon. Furthermore, RSI (14-period) is moving northward with a reading of 57.64, supporting a positive bias. Important support for the stock is positioned at AUD 0.130, while key resistance is placed at AUD 0.165.
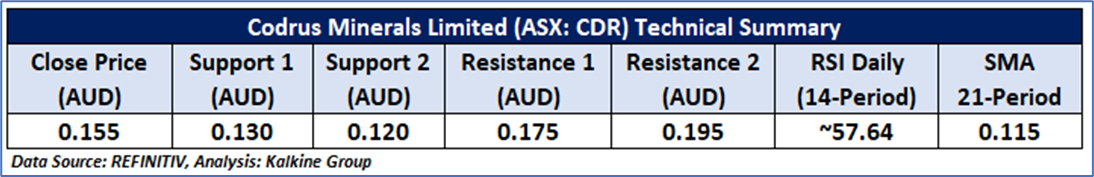
Daily Technical Chart – CDR
The technical levels for the stock were evaluated as per the current market price of AUD 0.145 per share at 12:15 PM Sydney, Australia GMT+10.
Note 1: Past performance is neither an Indicator nor a guarantee of future performance.
Technical Indicators Defined:
Support: A level at which the stock prices tend to find support if they are falling, and a downtrend may take a pause backed by demand or buying interest. Support 1 refers to the nearby support level for the stock, and if the price breaches the level, then Support 2 may act as the crucial support level for the stock.
Resistance: A level at which the stock prices tend to find resistance when they are rising, and an uptrend may take a pause due to profit booking or selling interest. Resistance 1 refers to the nearby resistance level for the stock and if the price surpasses the level, then Resistance 2 may act as the crucial resistance level for the stock.
Stop-loss: It is a level to protect further losses in case of unfavourable movement in the stock prices.
The Green colour line reflects the 21-period moving average. SMA helps to identify existing price trends. If the prices are trading above the 21-period, prices are currently in a bullish trend (Vice – Versa).
The Blue colour line reflects the 50-period moving average. SMA helps to identify existing price trends. If the prices are trading above the 50-period, prices are currently in a bullish trend (Vice – Versa).
The Orange/ Yellow colour line represents the Trendline.
The Purple colour line in the chart’s lower segment reflects the Relative Strength Index (14-Period), which indicates price momentum and signals momentum in trend. A reading of 70 or above suggests overbought status, while a reading of 30 or below suggests an oversold status.

_03_16_2026_07_57_11_233658.jpg)


 Please wait processing your request...