
 CA
 NZ
 UK
 US
 IND

 AU

 Share
 X (Formerly Twitter)
 Whatsapp
 Facebook
 LinkedIn
 Telegram
 Email This Article
 Copy Link
 Summarize with AI
 Chat GPT
 Perplexity

Highlights
- FY25 sales revenue increased 4% YoY to AUD 2,355.8 million, supported by cochlear implant unit growth.
- Underlying EBIT rose 3% to AUD 521.3 million, while operating cash flow declined 39% due to higher working capital.
- Return on equity and liquidity ratios improved in FY25, while gross and EBITDA margins moved lower.
Cochlear Limited (ASX:COH) is an Australia-based medical technology company specialising in implantable hearing solutions and sound processors. The company is involved in the development, manufacturing, and commercialisation of hearing technologies used by people with hearing loss across global markets.
FY25 financial performance
For the full year ended 30 June 2025 (FY25), the company reported sales revenue of AUD 2,355.8 million, compared with AUD 2,258.2 million in FY24, representing a 4% increase YoY. Underlying earnings before interest and tax (EBIT) rose 3% YoY to AUD 521.3 million in FY25 from AUD 504.8 million in the prior year.
Underlying net profit increased 1% YoY to AUD 392 million. The result was influenced by margin mix effects, higher research and development expenditure, increased cloud-related costs, and elevated working capital levels ahead of major product launches.
Cash flow and balance sheet movements
Operating cash flow for FY25 declined to AUD 237.6 million from AUD 388.8 million in FY24, a decrease of 39% YoY. The reduction was attributed to higher working capital requirements, increased inventory levels, and the timing of receivables.
Despite the cash flow decline, certain balance sheet metrics improved. Return on equity increased to 20.5% in FY25 from 19.9% in FY24. The current ratio also edged higher to 2.35 times, compared with 2.30 times in the previous year.
Margin trends and risks
Cochlear recorded a decline in gross margin to 74.2% in FY25 from 75.8% in FY24. EBITDA margin also decreased to 26.6% from 27.6% over the same period.
Recent business updates
In November 2025, AustralianSuper Pty Ltd increased its substantial holding in Cochlear from 5.20% to 6.21% through multiple purchases of ordinary shares.
Outlook for FY26
Looking ahead to FY26, the company is targeting assistance for more than 60,000 recipients worldwide and has outlined expectations for 11% to 17% YoY growth in underlying net profit. Developed market cochlear implant growth is expected to exceed 10%, supported by the global rollout of the Nucleus Nexa System, with earnings weighted toward the second half of the financial year.
In FY26, the company expects gross margin to be around 74%, with efficiency gains partly offset by research and development spending and emerging market mix. Normalisation of working capital is anticipated to contribute to improved net cash generation.
Share Performance of COH
COH shares eased 0.81% to close at AUD 258.79 per share on 17 December 2025. Over the past year, the stock has declined 13.24%. Recent performance has remained under pressure, with losses of 1.33% over the past week and 5.17% over the past month. The shares are down 12.59% over three months and 8.81% over six months, while the nine-month decline stands at 3.96%.
The 52-week high for the stock is AUD 323, achieved on 31 January 2025, and the 52-week low is AUD 246.14, reached on 7 April 2025.
Support and Resistance Summary
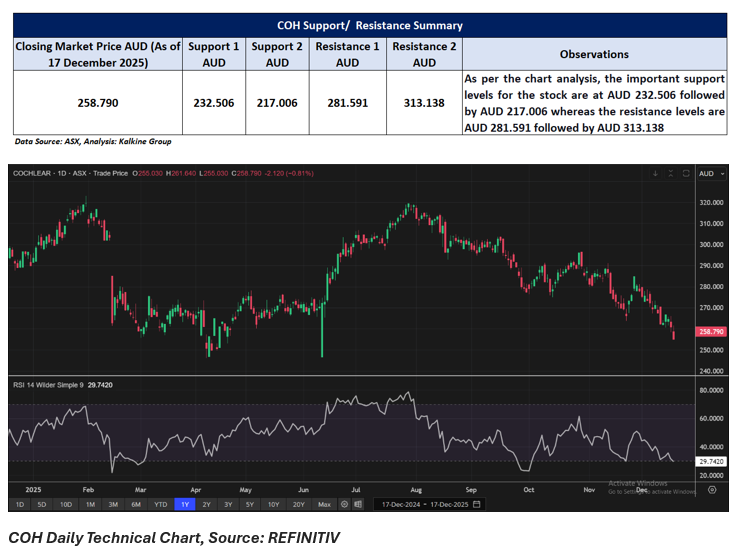
Note 1: Past performance is neither an Indicator nor a guarantee of future performance.
Note 2: The reference date for all price data, and currency, is 17 December 2025. The reference data in this report has been partly sourced from EODHD/Others.
Technical Indicators Defined:
Support: A level at which the stock prices tend to find support if they are falling, and a downtrend may take a pause backed by demand or buying interest. Support 1 refers to the nearby support level for the stock and if the price breaches the level, then Support 2 may act as the crucial support level for the stock.
Resistance: A level at which the stock prices tend to find resistance when they are rising, and an uptrend may take a pause due to profit booking or selling interest. Resistance 1 refers to the nearby resistance level for the stock and if the price surpasses the level, then Resistance 2 may act as the crucial resistance level for the stock.


 Nov 12, 2026





 Please wait processing your request...