Lukas Heldak@shutterstock
Highlights
- Australian Finance Group Limited (ASX: AFG) shares rose 7.667% to close at AUD 1.685 on Monday.
- In the last one year, the stock has fallen by nearly 11.3%.
- AFG shares are now trading above their 21-period and 50-period SMAs.
Australian Finance Group Limited (ASX: AFG) shares rose 7.667% to close at AUD 1.685 on Monday, 29 May 2023. Although there is no specific announcement from the company today that can be associated with today's up move, the stock seems to have been boosted by the positive movement of the broader market. The ASX All Ordinaries Index gained 0.83% today, with most sub-sectors ending in the green.
Since making a fresh 52-week low of AUD 1.350 on 23 March 2023, shares of this mortgage finance company have risen nearly 25%. Despite this move, AFG shares are down almost 11.3% in the last one year. The stock is now 18.20% away from its 52-week high of AUD 2.060 clocked on 26 August 2022.
For the half-year ended December 2022, AFG reported a net profit of AUD 21.9 million on revenues of AUD 525.2 million. While its revenue grew by 12 over 1HFY22, its reported net profit declined by 27% compared to 1HFY22, led by higher operating expenses.
Let's analyse the price chart of AFG to get an idea about the stock's near-term movement.
AFG’s Technical Analysis:
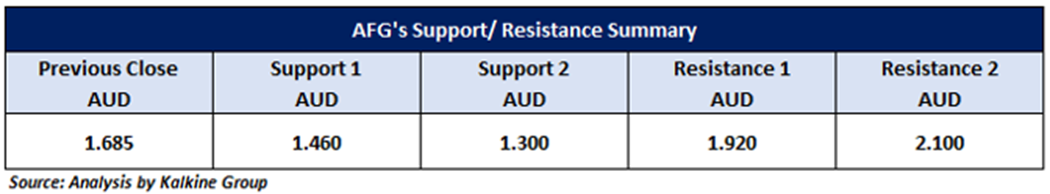
On the weekly chart, AFG share price is sustaining above the falling trendline support level, indicating the possibility of an upside movement. Now, the stock could head toward its next resistance level at AUD 1.920 and in the short term (2-4 weeks), prices may test this level. An upside movement above AUD 1.920 level supported by volumes could take the stock to its next resistance level of AUD 2.10 level.
Weekly Technical Chart – AFG
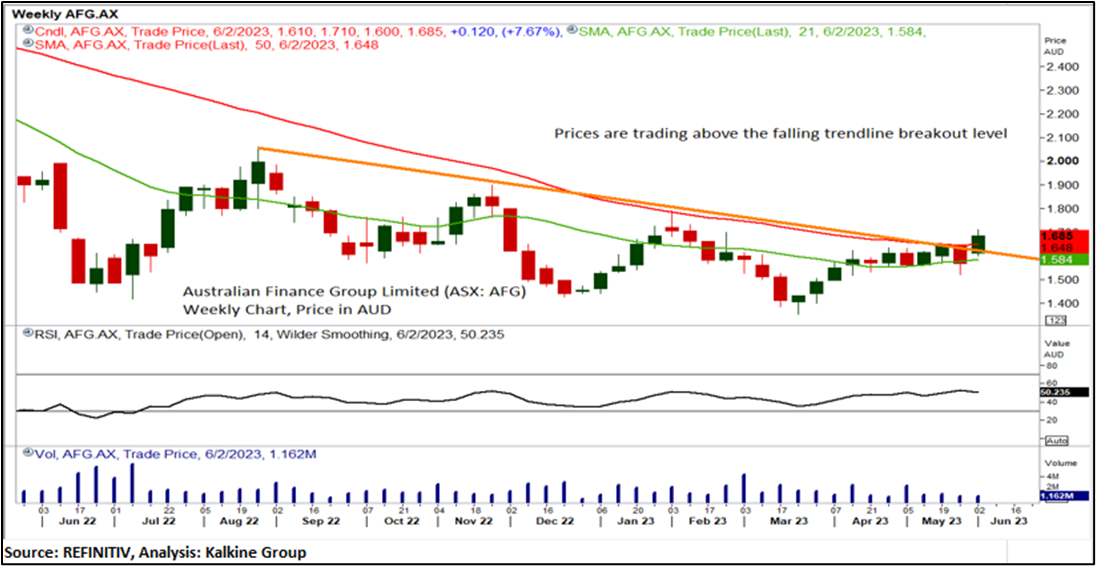
On the weekly chart, RSI (14-period) is moving above the midpoint and showing a reading of ~50.23 level, indicating positive price momentum. Volume analysis shows a positive signal for stock prices. The CMP is moving above the trend following indicators 21-period & 50-period SMAs, further supporting positive bias.
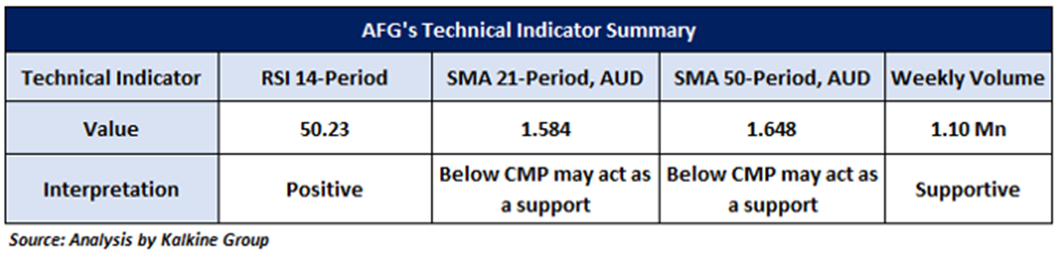
The technical levels for the stock were evaluated as per the closing price of AUD 1.685 per share, up by 7.667%, as on 29 May 2023.
Note 1: Past performance is neither an Indicator nor a guarantee of future performance.
Technical Indicators Defined:
Support: A level at which the stock prices tend to find support if they are falling, and a downtrend may take a pause backed by demand or buying interest. Support 1 refers to the nearby support level for the stock, and if the price breaches the level, then Support 2 may act as the crucial support level for the stock.
Resistance: A level at which the stock prices tend to find resistance when they are rising, and an uptrend may take a pause due to profit booking or selling interest. Resistance 1 refers to the nearby resistance level for the stock and if the price surpasses the level, then Resistance 2 may act as the crucial resistance level for the stock.
Stop-loss: It is a level to protect further losses in case of unfavourable movement in the stock prices.
The Green colour line reflects the 21-period moving average. SMA helps to identify existing price trends. If the prices are trading above the 21-period, prices are currently in a bullish trend (Vice – Versa).
The Blue colour line reflects the 50-period moving average. SMA helps to identify existing price trends. If the prices are trading above the 50-period, prices are currently in a bullish trend (Vice – Versa).
The Orange/ Yellow colour line represents the Trendline.
The Purple colour line in the chart's lower segment reflects the Relative Strength Index (14-Period), which indicates price momentum and signals momentum in trend. A reading of 70 or above suggests overbought status, while a reading of 30 or below suggests an oversold status.
Disclaimer:
This article (“Article”) has been prepared by Kalkine Pty Limited (ABN 34 154 808 312) (Australian financial services licence number 425376) (“Kalkine”) and its related bodies corporate who are authorised to provide general financial product advice. Kalkine.com.au and its associated pages are published by Kalkine.
Any information/advice provided in this article is general in nature and does not take into account your objectives, financial situation or needs. You should therefore consider whether the information is appropriate for your objectives, financial situation and needs before acting upon it.
There may be a Product Disclosure Statement, Information Memorandum or other offer document (“Offer Document”) for the securities or other financial products referred to in Kalkine articles. You should obtain a copy of the Offer Document and consider it before making any decision about whether to acquire the security or financial product.
Kalkine strongly recommends that you seek advice from a financial adviser, stockbroker or other professional (including taxation and legal advice) before acting on any advice/information in this Article or on the Kalkine website. Not all investments are appropriate for all people.
The information in this Article and on Kalkine website has been prepared from a wide variety of sources, which Kalkine, to the best of its knowledge and belief, considers accurate. Kalkine has made every effort to ensure the reliability of the information contained in its articles (including this Article), newsletters and websites. All information represents our views at the date of publication and may change without notice.
The information in this Article does not constitute an offer to sell securities or other financial products or a solicitation of an offer to buy securities or other financial products.
Kalkine does not issue, sell or deal in any financial products.
This Article may contain information on past performance of particular investments. Please note past performance is neither an indicator nor a guarantee of future performance.
To the extent permitted by law, and excluding any dishonesty or gross negligence by Kalkine, Kalkine disclaims and excludes all liability for any direct, indirect, implied, punitive, special, incidental or other consequential loss or damage arising from the use of or reliance on this Article, the Kalkine website and any information published on the Kalkine website without any warranties or representations by Kalkine to you. To the extent the law prohibits or limits this exclusion, Kalkine limits its liability to the resupply of services.
Please also read our Terms & Conditions and Financial Services Guide for further information.
Employees and/or associates of Kalkine and its related entities may hold interests in the securities or other financial products covered in this Article or on the Kalkine website. Any such employees and associates are required to comply with certain safeguards, procedures and disclosures as required by law.
Some of the images/music that may be used in the Article are copyright to their respective owner(s). Kalkine does not claim ownership of any of the pictures displayed/music used in the Article unless stated otherwise. The images/music that may be used in the Article are taken from various sources on the internet, including paid subscriptions or are believed to be in public domain. We have used reasonable efforts to accredit the source wherever it was indicated or was found to be necessary.
Kalkine Media Pty Ltd, an affiliate of Kalkine Pty Ltd, may have received, or be entitled to receive, financial consideration in connection with providing information about certain entity(s) covered on its website.
Copyright 2026 Krish Capital Pty. Ltd. (ABN 61629651510). All Rights Reserved. No part of this Article, or its content, may be reproduced in any form without our prior consent.


_03_16_2026_07_57_11_233658.jpg)


 Please wait processing your request...