
Key Highlights
- APA remains a core pick for income-focused investors, supported by its extensive network of gas transmission pipelines that generate reliable, inflation-linked cash flows.
- The group continues to pivot toward the energy transition, investing in renewable energy generation and electricity transmission to diversify its infrastructure footprint.
- Management has a long-standing track record of consistent distribution growth, underpinned by a robust balance sheet and disciplined capital allocation.
While APA Group (ASX:APA) has long been prized for its defensive qualities and stable dividend yield, the stock is currently entering a critical phase on the technical front. After a prolonged period of consolidation, the weekly chart is beginning to show a series of nested bullish structures that could signal a major multi-year trend reversal. This technical awakening comes as the market begins to re-evaluate the essential role of gas infrastructure in a firming energy market.
Essential Infrastructure and Cash Flow Stability
The fundamental case for APA is built on its dominant market position and the critical nature of its asset base:
- Dominant Network: APA owns and operates a $22 billion portfolio of energy infrastructure assets, including pipelines that deliver approximately half of Australia’s natural gas.
- Inflation Protection: A significant portion of APA's revenue is derived from long-term contracts with built-in inflation escalators, providing a natural hedge in a high-cost environment.
- Growth Pipeline: The acquisition of Alinta Energy’s Pilbara assets and the development of the Kurri Kurri lateral pipeline represent significant growth levers that enhance the group’s electricity and gas transmission capabilities.
Associated Risks
Despite its stable profile, APA faces risks from a shifting regulatory landscape that could impact future tariff structures and returns on regulated assets. Furthermore, the capital-intensive nature (capital expenditure ) of infrastructure development means the group remains sensitive to long-term interest rate movements, which can influence both debt-servicing costs and the relative attractiveness of its yield. Investors must also monitor the pace of the energy transition, as the long-term role of natural gas remains a subject of ongoing policy debate.
Technical Outlook
The technical landscape for APA has shifted from a deep correction into a high-conviction "bottoming" process, characterized by two overlapping bullish patterns.
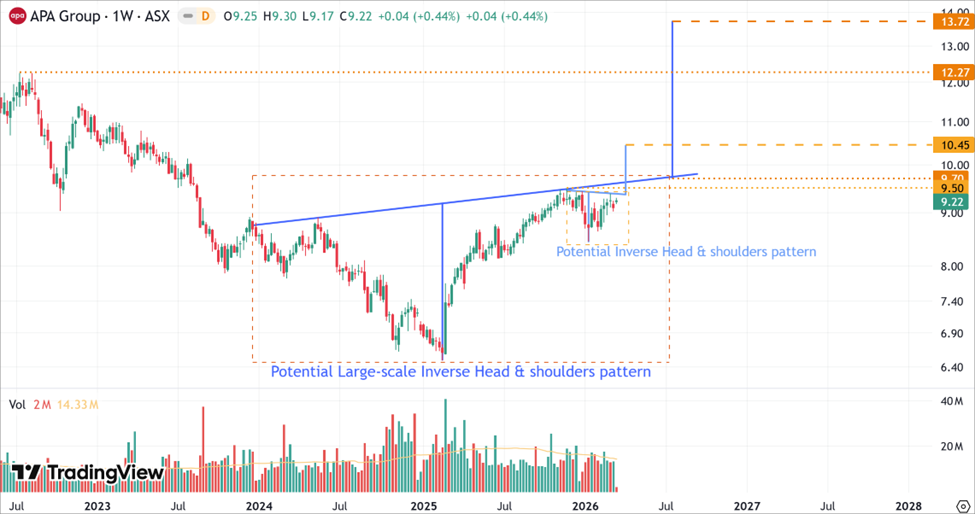
APA’s Daily Price Chart (at the closing price of 16th March 2026). Powered by: tradingview.com
- On the weekly chart, APA is developing a potential large-scale Inverse Head and Shoulders pattern dating back to late 2023. Within the right shoulder of this structure, a secondary inverse head and shoulders has formed, indicating a buildup of bullish momentum as the stock challenges its neckline.
- The price is currently testing a critical resistance zone between $9.50 and $9.70. A decisive weekly close above this level would provide the technical confirmation required to validate the reversal. The smaller pattern projects an initial target of $10.45, while a breach of major resistance at $12.27 would open the path toward the large-scale pattern's ultimate goal of $13.72.
Bottom Line
APA Group (ASX:APA) is a story of defensive fundamental resilience meeting a structural technical breakout. While its stable yield provides a solid foundation for value investors, the emergence of nested Inverse Head and Shoulders patterns suggests the stock is being re-rated for its next major growth cycle. Until the $9.70 level is decisively cleared, some consolidation is to be expected, but a successful breakout would position APA to challenge its historical highs near $13.72.


_03_16_2026_22_41_23_961043.jpg)

 Please wait processing your request...