
Key Highlights
- Delivered a record FY2025 revenue of US$1.18 billion, marking a 26% year-on-year increase.
- Successfully swung from a loss to a statutory NPAT of US$90 million in the 2025 financial year.
- The Motheo operation in Botswana remains a growth engine, with production jumping 29% in FY2025.
- Achieved a net cash position of US$13 million as of December 2025, reducing total net debt by US$301 million in just 12 months.
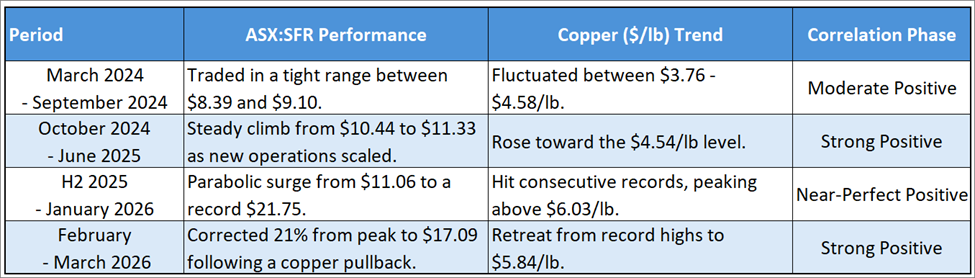
- Illustrating an extremely strong positive correlation with the copper price.
The fundamental story for Sandfire Resources (ASX:SFR) has been one of triumph, transitioning from a single-mine operator to a diversified global copper producer. However, despite these robust numbers, a "Warning Sign" has emerged on the daily chart that investors cannot afford to ignore.
Fundamental Strength vs. Market Reality
Sandfire has operated as a high-margin copper machine throughout 2025, maintaining an underlying EBITDA of US$528 million. Its strategic pivot to the MATSA and Motheo hubs has provided the operational leverage needed to capitalize on record-high copper prices. Yet, the stock remains a high-beta play on the underlying commodity. While its 21.6% per annum earnings growth forecast is impressive, the stock's extreme 0.94 correlation with Copper price (XCUUSD) means that when the copper market sneezes, Sandfire catches a cold.
Associated Risks
The primary risk remains commodity price volatility. Last Friday’s 9.58% tumble was triggered by a broader retreat in global copper prices, proving that even record profits cannot protect a producer from a sector-wide de-risking event. Furthermore, while debt has been slashed, the company has prioritized capital expenditure and debt repayment over dividends, leaving income-seekers on the sidelines for now.
Quantitive Point of View
From a quantitative perspective, the relationship between Sandfire Resources (ASX:SFR) and the copper spot price (XCUUSD) is defined by an extremely strong positive correlation of 0.94, with an R-squared of 0.88 over a two-year look-back period.
The correlation movements between the two assets are listed in the following table:
Technical Outlook
While the fundamentals remain solid, the technical setup has flashed a major bearish signal.
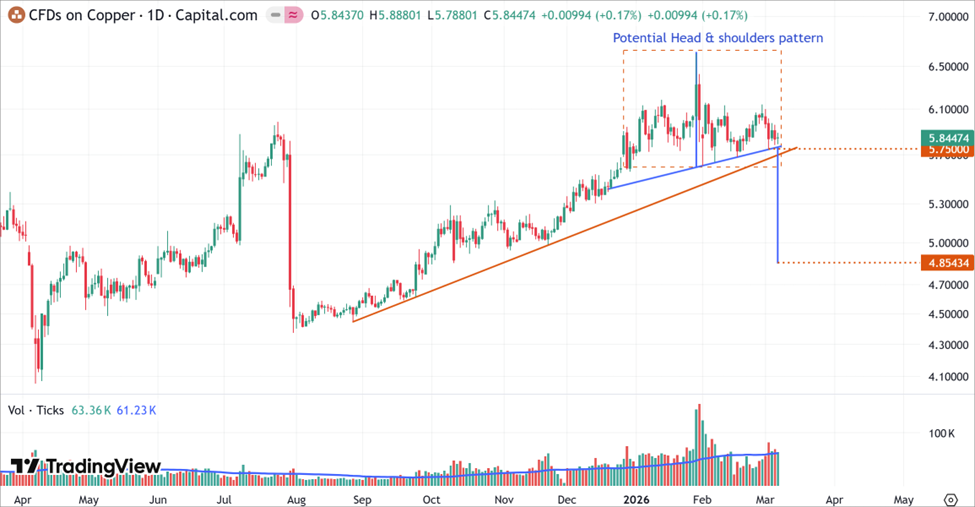
XCUUSD’s Daily Price Chart (at the closing price of 06th March 2026). Powered by: tradingview.com
- On the daily chart, the copper price is developing a potential Head and Shoulders pattern, with the neckline placed at $5.75/lb. The price is also supported by an upward trendline that began in August 2025.
- Should the price complete this pattern and break below the trendline, a significant correction should be expected, which could negatively affect copper stock prices.

SFR’s Daily Price Chart (at the closing price of 06th March 2026). Powered by: tradingview.com
- After breaking below a short-term upward trendline on 06 February 2026, SFR’s stock price continued its descent, falling below a significant support level established by its previous trough. This move was coupled with a 'Falling Window' and a spike in trading volume, confirming the formation of a short-term downtrend.
- Currently, the stock is testing support at a long-term trendline dating back to April 2024. Should this trendline fail to hold and the copper price simultaneously complete its Head and Shoulders pattern, a significant correction should be expected.
Bottom Line
- Sandfire Resources (ASX:SFR) has finally met a technical wall. While the long-term copper thematic remains intact, the combination of a trendline breach and a high-volume falling window suggests that the 'easy money' in the current leg has been made.
- Investors should closely monitor copper prices (XCUUSD); a bearish technical signal in the underlying commodity could trigger a deeper retracement in SFR’s stock price.


_03_10_2026_04_46_53_899081.jpg)

_03_10_2026_03_31_17_945849.jpg)

 Please wait processing your request...