
 CA
 NZ
 UK
 US
 IND

 AU

 Share
 X (Formerly Twitter)
 Whatsapp
 Facebook
 LinkedIn
 Telegram
 Email This Article
 Copy Link
 Summarize with AI
 Chat GPT
 Perplexity

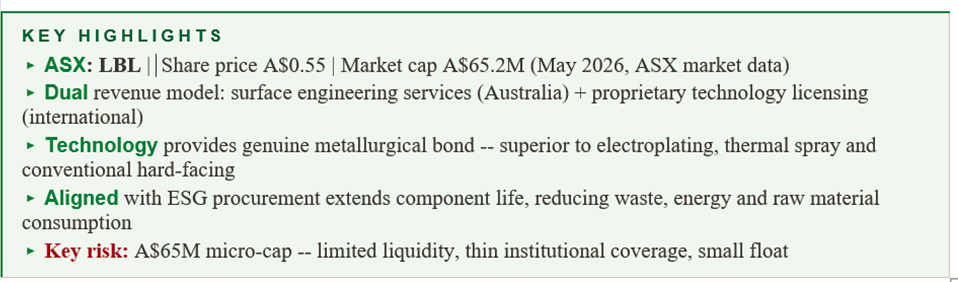
Laser Bond Limited (ASX: LBL)
A$0.55 | Market cap A$65.2M | Industrial Technology -- Advanced Surface Engineering
|
|
Business Analysis |
What LaserBond does: LaserBond Limited is an Australian industrial technology company that applies advanced surface engineering processes to industrial components. The company's core offering is laser cladding -- a process that uses a high-powered laser to fuse metallic alloys, carbides and ceramics onto the surface of industrial parts, creating a metallurgically bonded, wear-resistant layer. This is fundamentally different from surface coatings such as electroplating or paint: laser cladding becomes part of the substrate at the molecular level, producing durability and performance significantly beyond conventional surface treatments.
The technology addresses a universal industrial problem: wear. Components in Mining, oil and gas, power generation, food processing, steel mills, paper mills and general engineering are continuously degraded by abrasion, impact, corrosion and heat. Replacing these components is expensive; the LaserBond process extends their working life -- in many cases by three to five times -- at a fraction of replacement cost.
The two Business segments: LaserBond generates Revenue from two distinct streams. The Services segment applies the company's technologies to customer-supplied components at its facilities in Sydney (NSW) and Adelaide (SA), providing a recurring, relationship-based Revenue base from long-term industrial customers. The Products and Technology segment licenses LaserBond's proprietary equipment, processes and know-how to third parties -- primarily international partners -- who want to operate the technology themselves. This licensing model creates high-Margin, Capital-light Revenue with the potential for international scale without proportionate Investment in offshore plant and equipment.
LaserBond's customer base spans Mining (a major segment, given the extreme wear conditions in mineral processing), oil and gas (downhole tools, valves, pumps), power generation (turbine components, fan blades), food and beverage (hygiene-compliant wear surfaces) and general engineering. The Mining sector correlation is both a strength (a large, recurring market with high component replacement costs) and a risk (sensitivity to Mining industry Capital expenditure cycles).
|
|
Financial Analysis |
LaserBond's financial profile is that of a profitable, growing micro-cap industrial company with strong margins in its core services Business and meaningful but variable licensing Revenue. The company has been consistently profitable at the net level, generating positive free Cash Flow in most years, which is notable discipline for a company of its size and stage.
Revenue growth has been driven by expansion of the services Business (additional capacity at both Sydney and Adelaide sites), wins of new customer contracts in Mining and resources, and periodic technology licensing agreements. The licensing Revenue is lumpy by nature -- it depends on contract timing -- which creates some Earnings variability from year to year. Investors should assess LaserBond on a normalised, multi-year Earnings basis rather than single-year reported profit.
The Balance Sheet is clean: LaserBond carries minimal Debt and has funded its organic growth from operating Cash Flow. This is a significant positive for a micro-cap company -- it means the Business is self-sustaining without dilutive Equity raises, and management has not over-extended the Balance Sheet in pursuit of growth. Capital expenditure relates primarily to laser systems and processing equipment at the service facilities.
Gross margins in the services Business are healthy, reflecting the specialised, technically demanding nature of the work. The pricing premium over Commodity surface treatment alternatives is defensible because LaserBond's output is technically superior -- a customer whose A$250,000 Mining pump casing lasts five years instead of 18 months is not going to select the cheapest option. This premium pricing dynamic supports margins even as competition from larger industrial services companies intensifies.
|
|
Valuation |
At A$65.2 million Market Capitalisation and A$0.54 per share, LaserBond trades at a significant discount to the valuations typically ascribed to listed industrial technology companies with comparable growth profiles and Margin structures. The discount reflects its micro-cap status: institutional investors who manage funds too large to hold a meaningful position in a A$64M company simply cannot own LaserBond, regardless of its fundamental quality. This creates both the undervaluation and the mechanism for its eventual re-rating -- as the company scales toward A$150-200M market cap, institutional buyers enter and the valuation gap closes.
On an Earnings multiple basis, LaserBond typically trades at 15-25x trailing Earnings -- a range that appears reasonable for a profitable industrial technology company with proprietary intellectual property and a demonstrable competitive moat. The more interesting valuation lens is the technology licensing optionality: a single significant international licensing agreement, recurring at A$2-4M per year, would be highly accretive at the current scale.
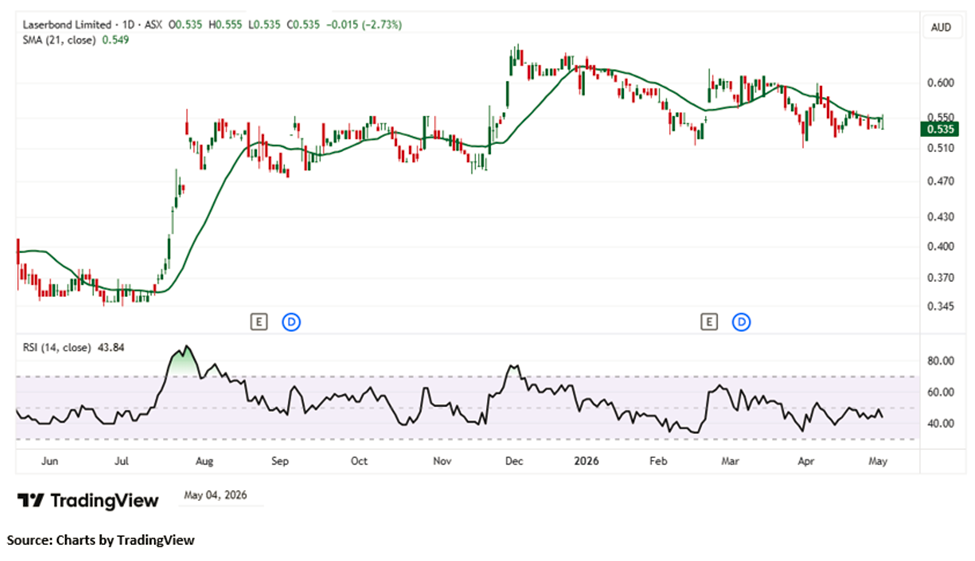
LBL is trading above a key rising support level, supported by a notable surge in Volume that reflects strong buying interest. The 14-day RSI stands at 43.84, suggesting early signs of recovery from oversold conditions with room for further upside. However, the stock is currently trading below its 21-day Moving Average, which is acting as a dynamic resistance level and capping near-term gains. Immediate support is placed at AUD 0.470 and 0.430, while resistance is seen at AUD 0.590 and 0.650, which may act as key near-term hurdles for further upside movement.
|
|
Outlook |
LaserBond's medium-term outlook is positive, supported by three structural tailwinds. First, the global Mining and resources industry -- LaserBond's largest customer segment -- is operating at historically high activity levels across many commodities, sustaining Demand for component wear protection. Second, increasing focus by large industrial companies on total cost of ownership (rather than upfront Capital cost) favours LaserBond's value proposition: a more expensive surface-engineered component that lasts longer has a lower life-cycle cost. Third, ESG procurement criteria in Supply chains are beginning to reward suppliers who can demonstrate reduced waste and environmental impact -- LaserBond's component life extension reduces the carbon footprint associated with Manufacturing replacement parts.
The key growth catalyst remains international technology licensing. LaserBond has been pursuing this pathway for several years, with agreements in markets including the United States and Asia. Execution of a material recurring licensing agreement with a large international industrial services company would be the most significant value-creating event in the company's near-term outlook.
|
|
Frequently Asked Questions |
Q: What does LaserBond actually do?
A: LaserBond applies advanced surface engineering -- primarily laser cladding -- to industrial components across Mining, oil and gas, power generation and general engineering. The technology extends component working life by fusing wear-resistant alloys onto surfaces at the molecular level, reducing replacement frequency and cost for customers.
Q: How does LaserBond make money?
A: Through two segments: a Services Business (applying its technology to customer components at Sydney and Adelaide facilities) and a Products and Technology Business (licensing its proprietary equipment and processes to international third parties). Services is recurring; licensing is higher-Margin but lumpy.
Q: What is the biggest risk for LaserBond investors?
A: Micro-cap Liquidity: at A$64M market cap, the stock has limited daily trading Volume, minimal institutional coverage, and wide bid-ask spreads. Exiting a position during market stress may be difficult. The Business itself is profitable and self-funding, but price Volatility is amplified at this scale.
Q: What would re-rate the stock?
A: A material international licensing agreement -- particularly with a major industrial services company in North America or Europe -- would be a significant catalyst. Any Revenue announcement significantly above market expectations would also drive a re-rating.
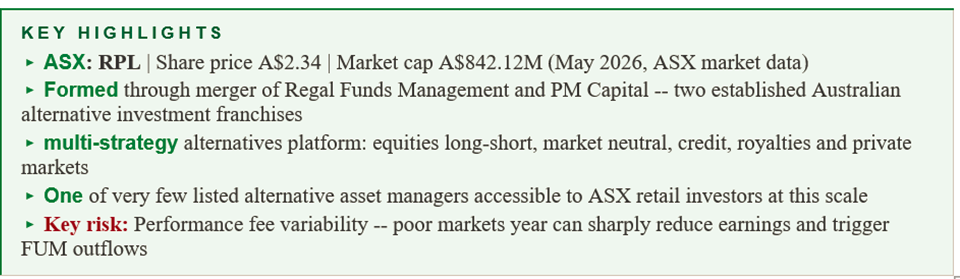
Regal Partners Limited (ASX: RPL)
A$2.34 | Market cap A$842.12M | Alternative Asset Management
|
|
Business Analysis |
The company's structure: Regal Partners was formed through the Merger of Regal Funds Management (a leading Australian equities long-short and alternatives manager) and PM Capital (a global equities and fixed income manager with a 25-year heritage). The combined entity is listed on the ASX and provides investors with exposure to a diversified alternatives management platform whose Revenue is generated through management fees, performance fees and co-Investment returns.
The Business manages Capital across multiple strategies. The equities long-short strategies -- Regal's heritage Business -- target absolute returns regardless of market direction by holding long positions in companies expected to outperform and short positions in companies expected to underperform. The market neutral strategies aim to generate returns with minimal market Beta. Credit strategies invest in private and public Credit markets. The royalties Business acquires Royalty streams over productive Assets (Mining, energy, infrastructure). Private markets Investment completes the platform.
Revenue dynamics: Management fees provide the recurring Revenue base, typically calculated as a percentage of funds under management (FUM). Performance fees -- calculated as a percentage of Investment returns above a hurdle rate -- are the most significant variable component and can dominate total Revenue in strong performance years. The Australian alternatives management industry has historically generated strong performance fee income, but this is explicitly dependent on Investment returns.
Regal's Shareholder base includes the founding management teams, who retain meaningful Equity stakes -- a strong alignment of interest with external shareholders. The company has been an active acquirer of smaller alternative Investment managers and fund boutiques, using its listed currency and institutional distribution to build scale.
|
|
Financial Analysis |
Regal Partners' financial performance is characterised by high but variable Revenue, driven by the performance fee cycle. In strong performance years, the company's Earnings significantly exceed management fee Revenue alone. In weak or negative performance years, performance fees disappear and Revenue falls to the management fee base. This binary Revenue dynamic is the defining financial characteristic of the Business and the primary lens through which Earnings and valuation should be assessed.
Management fee Revenue is a function of FUM. Regal has grown FUM significantly since listing, through both organic inflows (from existing and new investors in its funds) and acquisitions of new Investment management businesses. FUM growth is reported in quarterly updates and is the most closely watched operational metric. Growing FUM provides a rising management fee base that reduces dependence on performance fees and provides more predictable Earnings.
The cost base is dominated by staff expenses -- portfolio managers, analysts, risk managers and distribution professionals. The variable component of staff costs (bonuses and Carried Interest payments to Investment teams) moves directionally with performance fee Revenue, providing a natural hedge: when performance fees rise, staff costs rise proportionately; when performance fees fall, variable compensation falls. This cost flexibility is an important structural feature of the fund management Business model.
Regal maintains a strong Balance Sheet with co-Investment positions in its own funds. These co-investments align management with investor interests and also generate Investment returns for the company's own account. At A$871M market cap, Regal trades at a valuation that reflects its position as a large and growing alternative asset manager rather than a small-cap.
|
|
Valuation |
Alternative asset managers are typically valued on a sum-of-the-parts basis: the management fee Business (valued as a multiple of recurring management fees, typically 15-25x) plus a separate value for performance fees (typically capitalised at a lower multiple, reflecting their variability) plus a value for any co-investments and Balance Sheet Assets.
At A$842M market cap, Regal's valuation reflects a combination of its established management fee base, its demonstrated performance track record and the structural growth in alternatives allocation by Australian investors. The company typically trades at a premium to its management fee Revenue alone, reflecting the value attributed to future performance fees and FUM growth. The appropriate entry point for investors is typically after a period of performance fee disappointment, when the stock has de-rated toward its management fee base value -- buying the recurring Revenue at a discount.
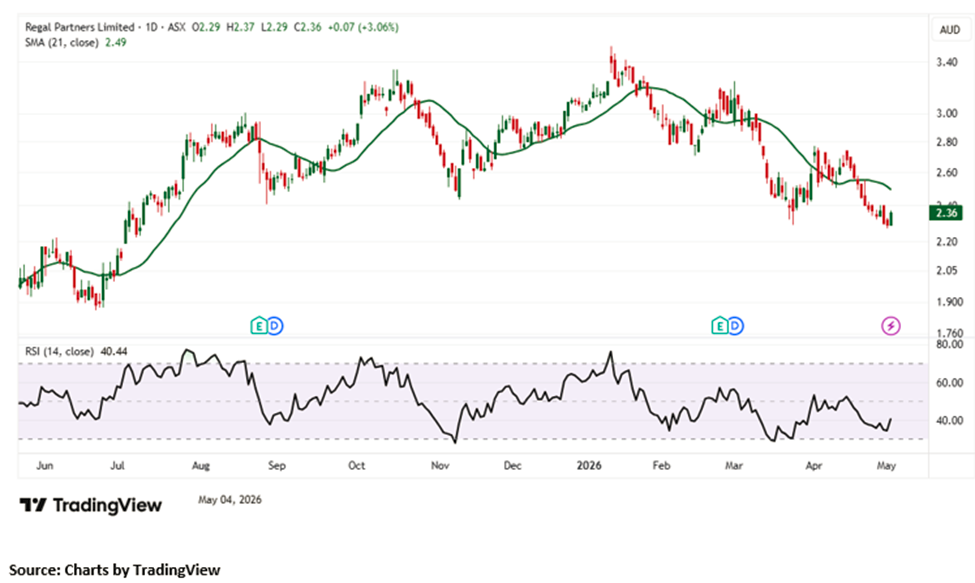
RPL is trading above a key rising support level, supported by a notable surge in Volume, indicating improving buying interest and potential accumulation. The 14-day Relative Strength index (RSI) stands at 40.44, suggesting stabilizing momentum with scope for a gradual recovery. However, the stock remains below its 21-day Moving Average, which continues to act as a dynamic resistance and may cap near-term upside. Immediate support is placed at AUD 2.10 and AUD 1.90, while resistance is seen at AUD 2.70 and AUD 2.90. A decisive move above the 21-day Moving Average level would be required to confirm strengthening bullish momentum, while failure to hold above support could lead to renewed downside pressure.
|
|
Outlook |
The medium-term outlook for Regal Partners is underpinned by two structural trends. First, the ongoing shift of Australian Superannuation and institutional Capital toward alternatives: the Australian Superannuation industry is approaching A$4 trillion in Assets and has been systematically increasing its allocation to alternative investments, a trend that directly benefits managers with Regal's profile. Second, the growing preference among high-net-worth investors for multi-strategy alternatives platforms over single-strategy funds -- precisely the model Regal has been building.
The near-term outlook is more dependent on market conditions. In a strong equities environment with clear stock-picking differentiation between companies, Regal's long-short strategies tend to generate strong performance fees. In a low-dispersion, momentum-driven market, long-short Alpha is harder to generate. The company's Diversification across multiple strategies is specifically designed to reduce dependence on any single market condition.
|
|
Frequently Asked Questions |
Q: What type of Investment company is Regal Partners?
A: Regal Partners is a listed alternative asset manager -- it manages money on behalf of investors (Superannuation funds, high-net-worth individuals, institutional investors) across multiple alternative Investment strategies including equities long-short, Credit, royalties and private markets. It earns management fees and performance fees on the Capital it manages.
Q: How does Regal make money?
A: Through management fees (a percentage of FUM, charged annually) and performance fees (a percentage of Investment returns above a hurdle rate). Management fees are recurring; performance fees are variable and can be zero in poor performance years.
Q: What are the biggest risks?
A: Performance fee variability is the primary Earnings risk -- a bad year for Regal's Investment strategies means no performance fees and potentially FUM outflows. Key-person risk is also material: the departure of senior portfolio managers could trigger redemptions.
Praemium Limited (ASX: PPS)
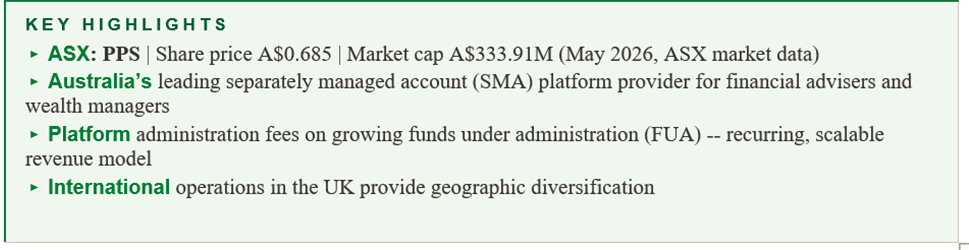
A$0.685 | Market cap A$333.91M | Wealth Management Technology -- SMA Platform
|
|
Business Analysis |
The SMA platform Business: Praemium operates a technology platform for financial advisers and Wealth managers that enables the management of client Investment portfolios held in separately Managed Account (SMA) structures. An SMA holds actual securities in the investor's own name -- unlike a managed fund, which pools investor money -- providing tax efficiency (direct Capital gains management at the individual investor level), portfolio transparency (clients can see every underlying holding) and customisation flexibility. SMAs represent the premium end of the managed portfolio market and have been growing strongly as Australian financial advisers seek to differentiate their services.
The platform provides advisers with portfolio construction and Rebalancing tools, managed portfolio models, administration, reporting, tax accounting and custody services through an integrated technology stack. Praemium earns a platform administration fee -- typically calculated as a percentage of FUA -- on all Assets administered through the platform. As FUA grows, Revenue grows proportionately, with minimal marginal cost for incremental FUA. This Operating Leverage structure is the defining financial characteristic of the Business.
Australian and international operations: Praemium's Australian operations are the primary Revenue contributor and the core of the Business. The company also operates in the United Kingdom, providing a similar SMA and portfolio administration platform to UK advisers and Wealth managers. The UK Business provides Revenue Diversification across markets and currencies, and operates in a regulatory environment that has been progressively moving toward transparent, fee-for-service advice structures -- the same direction that has driven SMA adoption in Australia. [Praemium has been an active consolidator in the Australian Wealth technology sector, acquiring competing or complementary technology platforms and integrating them into its service offering. The acquisitive strategy has accelerated FUA growth beyond what organic adviser adoption alone would produce, and has added technology capabilities and client bases that strengthen the platform's competitive position.
|
|
Financial Analysis |
Praemium's Revenue is almost entirely derived from platform administration fees -- a highly predictable, recurring Revenue stream that grows directly with FUA. The company has reported consistent FUA growth across both Australian and international segments, driving progressive Revenue growth with the Operating Leverage characteristic of platform businesses. As fixed technology infrastructure costs are spread over a larger FUA base, EBITDA margins expand.
The company provides regular FUA updates (typically quarterly) which are the most closely watched financial metric for Praemium investors. FUA growth of 10-20 per cent per year, driven by a combination of net new adviser adoption, existing adviser FUA growth (reflecting positive markets and client inflows) and Acquisition-related FUA additions, has characterised recent periods.
Praemium has been investing in technology development and sales and Marketing to accelerate platform adoption. This Investment phase has suppressed reported profit margins relative to the long-term Margin potential of the Business. Investors assessing Praemium should model the normalised Margin profile at scale rather than current reported margins during Investment phases.
The Balance Sheet is moderately capitalised with some net cash following the company's most recent acquisitions. Praemium has periodically raised Equity Capital to fund acquisitions, which creates dilution risk for existing shareholders. The frequency and pricing of any future Capital raises is an important ongoing consideration.
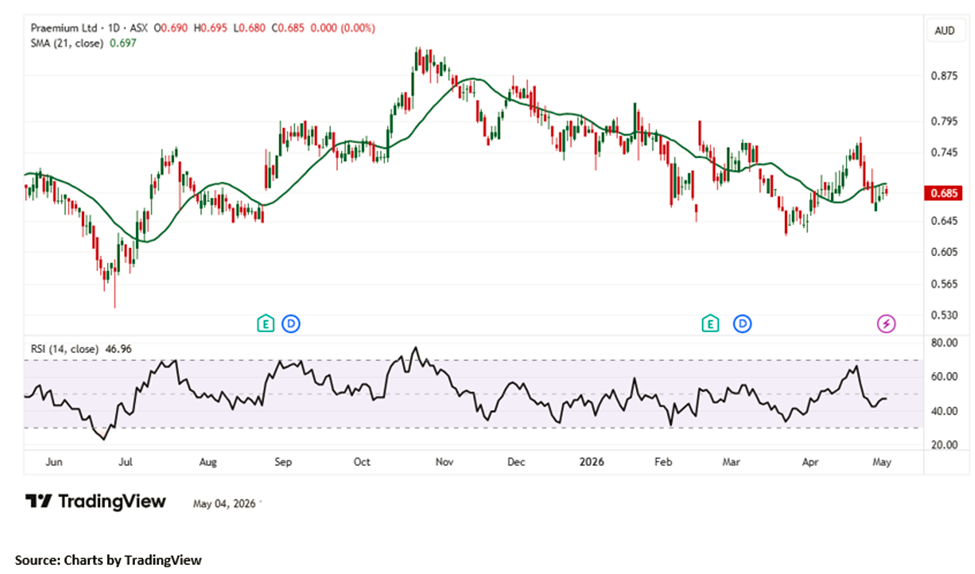
PPS is currently trading above a key rising support level, with a notable increase in Volume pointing to improving buying interest and early signs of accumulation. The 14-day Relative Strength index (RSI) stands at 46.96, indicating stabilizing momentum with potential for a gradual recovery. However, the stock continues to trade below its 21-day Moving Average, which is acting as a dynamic resistance and may limit near-term upside. Immediate support is positioned at AUD 0.620 and AUD 0.580, while resistance levels are seen at AUD 0.760 and AUD 0.820. A sustained move above the 21-day Moving Average, breakout would be required to confirm a strengthening bullish outlook. Conversely, a breakdown below the immediate support levels could expose the stock to renewed selling pressure.
|
|
Valuation |
Wealth technology platform companies are valued primarily on Revenue multiples and EV/EBITDA, reflecting the importance of FUA growth and Revenue scalability over current Earnings. The appropriate valuation framework for Praemium is a discounted Cash Flow model that captures the terminal value of the FUA-based Revenue stream at normalised margins -- an exercise that is sensitive to the assumed long-term FUA level and platform fee rate.
At A$326M market cap, Praemium trades at a modest multiple relative to its closest comparable -- listed Australian Wealth platforms including Hub24 (ASX: HUB) and Netwealth (ASX: NWL). Praemium is smaller and grows more slowly than those platforms at present, hence the valuation discount. The Investment case rests on FUA growth accelerating as the adviser distribution push takes hold, Margin expansion as Operating Leverage becomes apparent, and the possibility of strategic interest from larger financial services groups.
|
|
Outlook |
The structural growth environment for Praemium is strong. The post-Royal Commission restructuring of Australian financial advice has produced a smaller, more professional adviser population that increasingly relies on technology platforms rather than vertically integrated product manufacturers for Investment management. This adviser cohort is actively evaluating SMA platforms, and Praemium's established position, technology depth and competitive pricing make it a credible alternative to the market leaders.
Internationally, the UK regulatory environment is moving in a direction that favours SMA adoption -- the same trajectory that drove Australian SMA growth in the decade following the Future of Financial Advice reforms. If the UK Business develops along the Australian trajectory with a 5-10 year lag, it represents a significant option value.
|
|
Frequently Asked Questions |
Q: What is an SMA and why does it matter for Praemium?
A: A separately Managed Account holds individual securities in the investor's own name (unlike a managed fund, which pools all investors). This provides tax efficiency, transparency and customisation advantages. Praemium provides the technology platform that enables advisers to manage SMA portfolios efficiently at scale. As SMA adoption grows, Praemium's FUA grows. [Source: PPS Annual Report FY2024]
Q: Why did the data show 5 rewards and 0 risks?
A: The source data classified Praemium with 5 rewards and no disclosed risks. This is an unusually positive profile. Our analysis notes that risks do exist -- FUA growth deceleration, platform competition (Hub24, Netwealth, Netwealth), Capital raising dilution risk, and UK regulatory complexity. Investors should conduct independent Due Diligence.
Q: How does Praemium grow Revenue?
A: Primarily through FUA growth: new adviser platform adoption, growth in existing adviser client books, market appreciation of administered Assets, and acquisitions. Revenue scales with FUA at a flat percentage fee rate, creating Operating Leverage. [Source: PPS Annual Report FY2024]
Q: What is the Investment catalyst?
A: FUA milestone announcements, particularly crossing round-number thresholds (e.g. A$50B, A$75B in FUA) that signal inflection in adviser adoption. Any strategic Acquisition of an adviser licensee or competing platform would also be material.
Ora Banda Mining Ltd (ASX: OBM)
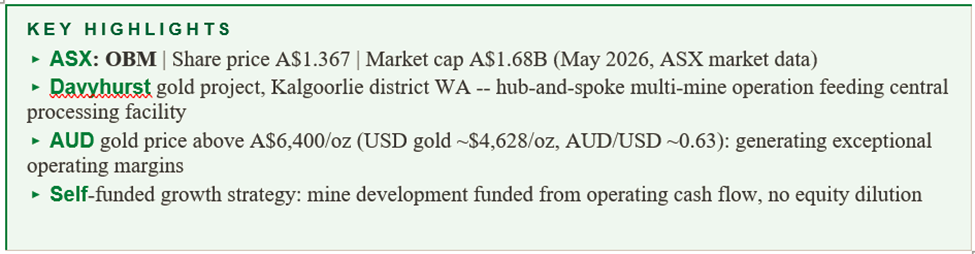
A$1.367 | Market cap A$1.68B | Gold Mining -- Davyhurst, Western Australia
|
|
Business Analysis |
The Davyhurst Hub: Ora Banda Mining's primary asset is the Davyhurst gold project, located approximately 110 kilometres north-northwest of Kalgoorlie in the Eastern Goldfields of Western Australia. Davyhurst is not a single mine but a hub-and-spoke system: multiple open-cut and underground Mining operations across the project area (including Sand King, Missouri, Riverina and associated satellite deposits) feed ore to a central processing Facility. This approach allows the company to blend ore from different sources, optimise mill feed grade and manage mine sequencing across a portfolio of ore bodies rather than depending on a single deposit.
The Davyhurst area has a long history of gold Mining, with historical workings across many of the ore bodies that Ora Banda is now Mining. The modern operation brings together a series of smaller deposits that individually would be sub-economic as standalone operations but collectively, processed through a shared mill, generate viable Mining Economics. This aggregation model is common in the Eastern Goldfields, where the Kalgoorlie area has produced gold continuously for over 130 years from a very large number of ore bodies of varying size and grade.
Production profile: Ora Banda has been growing production consistently over recent periods, increasing mill throughput through processing upgrades and bringing new ore sources into production. Production guidance and quarterly updates are the primary sources for current output data. At the AUD gold price of approximately A$6,400 per troy ounce -- reflecting USD gold near $4,628/oz and an AUD/USD rate around 0.63-0.65 -- the company's operations are generating margins that are transformational relative to any prior period in Davyhurst's history.
Western Australia Jurisdiction adds significant value to the Investment thesis. WA has world-class Mining infrastructure (roads, power, water, accommodation, skilled workforce), a highly experienced Mining regulatory framework, and a long-established legal system for Mining titles and royalties. Compared with international gold operations in Africa, Southeast Asia or Latin America, WA operations command a Jurisdiction premium in both valuation and in the pricing of gold streaming and Royalty transactions.
|
|
Financial Analysis |
Ora Banda's financial results are fundamentally driven by two variables: the Volume of gold produced and the AUD gold price received. At A$6,400 per troy ounce, every 1,000 ounces of production generates A$6.4 million in Revenue. Annual production (disclosed in quarterly updates and the Annual Report) combined with the prevailing AUD gold price allows a straightforward Revenue calculation -- the financial complexity lies in the cost structure.
All-In Sustaining Cost (AISC) per ounce is the primary financial metric for gold investors. AISC includes all cash operating costs, royalties, sustaining Capital expenditure and administrative costs required to sustain current production -- providing a comprehensive view of the real cost of producing gold. Ora Banda's AISC trajectory (disclosed in quarterly production reports) is the key determinant of operating Margin at any given gold price. At AUD gold of A$6,400/oz and an AISC in the A$2,000-3,000 range (estimated; actual figures in company filings), operating margins are very strong.
The company has been self-funding its growth Capital -- Investment in new mine development, underground decline extensions and processing plant upgrades -- from operating Cash Flow. This is a positive indicator of the strength of cash generation at current prices and of management's financial discipline. No significant dilutive Equity raises have been required during the current gold price cycle.
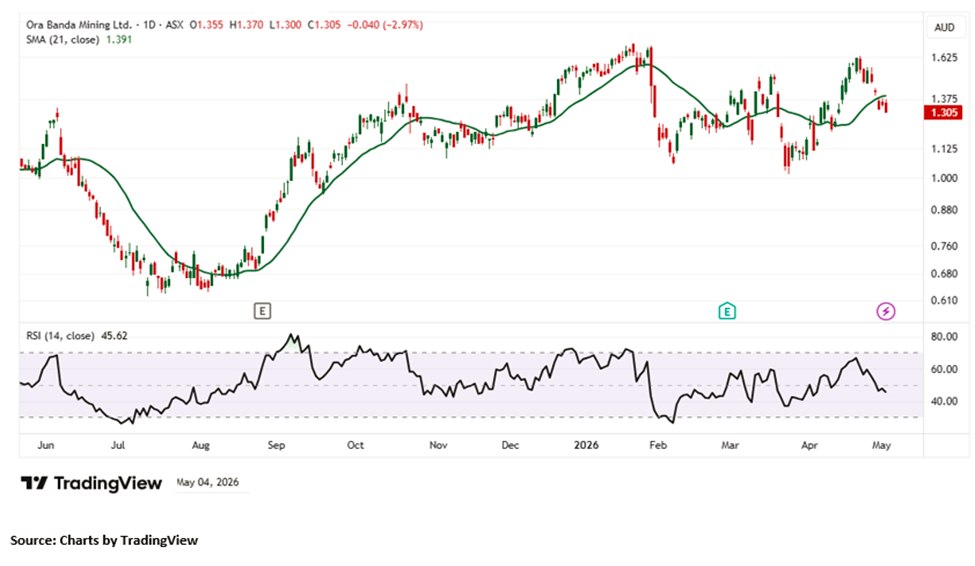
OBM is currently trading above a key horizontal support level, with a notable increase in Volume indicating improving buying interest and early signs of accumulation. The 14-day Relative Strength index (RSI) stands at 45.62, suggesting stabilizing momentum with scope for a gradual recovery. However, the stock remains below its 21-day Moving Average, which continues to act as a dynamic resistance and may limit near-term upside. Immediate support is positioned at AUD 1.15 and AUD 1.05, while resistance levels are seen at AUD 1.450 and AUD 1.650. A sustained move above the 21-day Moving Average, along with a breakout above AUD 1.450, would be required to confirm a strengthening bullish outlook. Conversely, a breakdown below the immediate support levels could expose the stock to renewed selling pressure.
|
|
Valuation |
Gold Mining companies are valued on a combination of net asset value (NAV -- the discounted Cash Flow value of reserves at an assumed gold price), EV/EBITDA and EV per ounce of resource. At A$1.68B market cap, Ora Banda is a mid-tier gold company rather than a Penny Stock by any conventional market cap measure, and its valuation reflects full pricing for the current gold price environment.
The key valuation risk is gold price normalisation. If the AUD gold price returns toward A$4,000-5,000 per ounce from current A$6400+ levels, the operating Margin profile changes dramatically, and with it the Earnings-based and NAV-based valuation. Investors entering at current levels need to be comfortable that the gold price -- either in USD terms or through AUD weakness -- remains structurally elevated. The 1-year gold return of +39.43 per cent (TradingView, 30 April 2026) supports the near-term bull case; the medium-term direction is less certain.
|
|
Outlook |
Ora Banda's outlook is directly linked to the gold price, production growth at Davyhurst, and the results of ongoing resource extension drilling. On all three fronts, the near-term picture is positive. Gold remains at historically elevated levels. Davyhurst production is growing. Drilling results from satellite deposits have been encouraging, suggesting potential mine life extension beyond current JORC reserves.
The medium-term strategic question is whether Ora Banda grows organically within the Davyhurst footprint, pursues acquisitions of neighbouring or complementary gold Assets, or positions itself as an Acquisition target for a larger gold producer seeking WA goldfield exposure. At A$2.73B, it is large enough to be a credible acquirer of smaller WA gold operations and small enough to be an attractive Acquisition for a larger gold producer.
|
|
Frequently Asked Questions |
Q: What does Ora Banda Mine produce?
A: Gold. Exclusively gold, from the Davyhurst project area north of Kalgoorlie in Western Australia. The company mines ore from multiple open-cut and underground sources, processes it through the Davyhurst mill, and sells gold doré (a semi-pure gold-silver alloy) to refiners. [Source: OBM Annual Report FY2024]
Q: Why is the AUD gold price so important?
A: Gold is priced globally in US dollars, but Ora Banda's costs are almost entirely in Australian dollars. A weaker AUD inflates the AUD gold price received by Australian miners without any change in the USD gold price. The current combination of high USD gold (~$4,628/oz) and a relatively soft AUD produces an AUD gold price above A$6,400/oz, creating exceptional margins for WA gold producers.
Q: Is Ora Banda really a Penny Stock?
A: At A$2.73B market cap, no. It is a mid-tier ASX gold producer. Its inclusion on a Penny Stock list likely reflects its share price below A$2.00 rather than any conventional Penny Stock definition. The risk profile differs materially from the other four stocks on this list.
Q: What would hurt Ora Banda's share price most?
A: A sustained fall in the gold price -- either in USD terms (e.g. back toward $3,000/oz) or through AUD strengthening (e.g. AUD/USD rising to 0.80). A significant operational disruption at Davyhurst (fire, flood, geotechnical event) would also be material but is a lower-probability event.
Australian Ethical Investment Ltd (ASX: AEF)
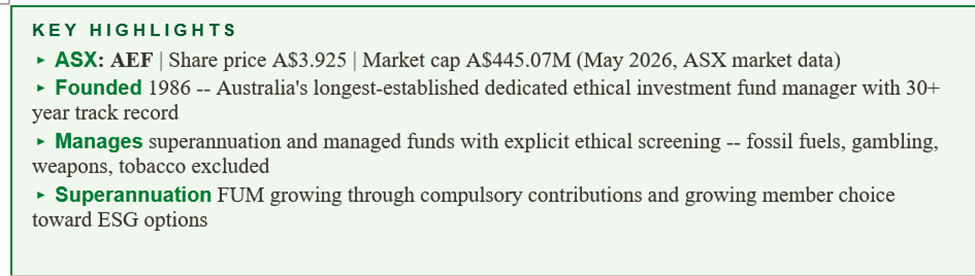
A$3.925 | Market cap A$445.07M | ESG Fund Management -- Superannuation and Managed Funds
|
|
Business Analysis |
Company heritage and differentiation: Australian Ethical Investment Limited was founded in 1986 -- three years before the term ESG was coined -- and has operated as a dedicated ethical Investment manager for nearly four decades. This longevity is the company's most important competitive differentiator in a market now crowded with ESG claims from major financial institutions. When institutional fund managers and Superannuation funds face scrutiny over Greenwashing, Australian Ethical can point to a 30+ year history of applying genuine, independently verified ethical screens to every Investment decision.
The company's ethical framework is formalised in a published Ethical Charter that sets out the industries and activities that are excluded from Investment (weapons, gambling, tobacco, fossil fuel extraction, live animal export, old-growth forest logging) and the positive qualities sought in investments (renewable energy, sustainable land management, educational services, healthcare and social infrastructure). This charter is not a Marketing document -- it is operationally binding and shapes every Investment decision across every fund.
Superannuation: the growth engine: Australian Ethical manages the Australian Ethical super fund, which has been one of the fastest-growing Superannuation funds in Australia by percentage FUM growth over recent periods. Australia's compulsory Superannuation system generates approximately A$100 billion in new contributions annually, and choice members -- Superannuation fund members who have selected their fund rather than remaining in a default option -- are disproportionately drawn to ethical Options. The rise of younger members exercising choice and prioritising ESG alignment is a powerful and durable structural tailwind for Australian Ethical's super fund.
Beyond Superannuation, Australian Ethical manages retail managed Investment schemes across Australian equities, international equities and balanced Options. These managed funds attract direct investors who want ethical screening without the Superannuation wrapper, and provide an additional FUM growth pathway beyond the super channel.
|
|
Financial Analysis |
Australian Ethical's financial model is a conventional funds management structure: Revenue is generated through management fees calculated as a percentage of FUM, with Revenue growing proportionately as FUM grows. The company does not charge performance fees on its core products, which creates more predictable but less variable Revenue than a company like Regal Partners. Consistent FUM growth -- driven by super contributions, new member joins, and positive Investment returns -- is the primary Revenue driver.
FUM is disclosed regularly (typically half-yearly in conjunction with financial results and periodically in member growth announcements). Super member numbers are the operational metric most closely watched by investors in Australian Ethical: each new member contributes their mandated Superannuation contributions to the fund, creating a reliable and growing FUM base. The company has been investing in Marketing and member Acquisition campaigns, with the cost of member Acquisition (and its payback period) being a key efficiency metric.
Operating costs include Investment management, administration, Marketing, compliance and regulatory costs. The compliance and regulatory burden for a Superannuation fund operator is significant -- APRA regulation, ASIC oversight, and the requirements of the Superannuation Industry Supervision Act impose material ongoing costs. Australian Ethical manages this regulatory cost within its overall operating structure, and compliance spending is a non-discretionary cost that grows with the scale of the super fund.
Profitability has been growing as the FUM base expands beyond the level required to cover the Fixed Cost base. The Operating Leverage of the funds management model -- fixed technology and compliance costs spread over a growing FUM base -- creates the potential for Margin expansion as the company scales. However, Investment in Marketing and member Acquisition has been sustained at a high level, moderating reported margins in the near term.
|
|
Valuation |
Australian Ethical is typically valued as a percentage of FUM -- a standard approach for listed fund managers. The valuation range depends on growth expectations: faster-growing fund managers command higher percentages of FUM. At A$445.07M market cap, Australian Ethical is valued at a meaningful premium to its FUM, reflecting expectations of continued strong growth.
Comparable listed ethical fund managers are rare, making precise comparable analysis difficult. The closest Australian comparables are listed Wealth managers such as Perpetual and Pendal (now merged), and dedicated ESG platforms internationally. The company's unique heritage and verifiable track record support a premium to generic fund management valuations. The risk to current valuation is FUM growth deceleration -- if member Acquisition slows or markets produce negative returns that reduce FUM, the growth premium contracted in the share price would come under pressure.
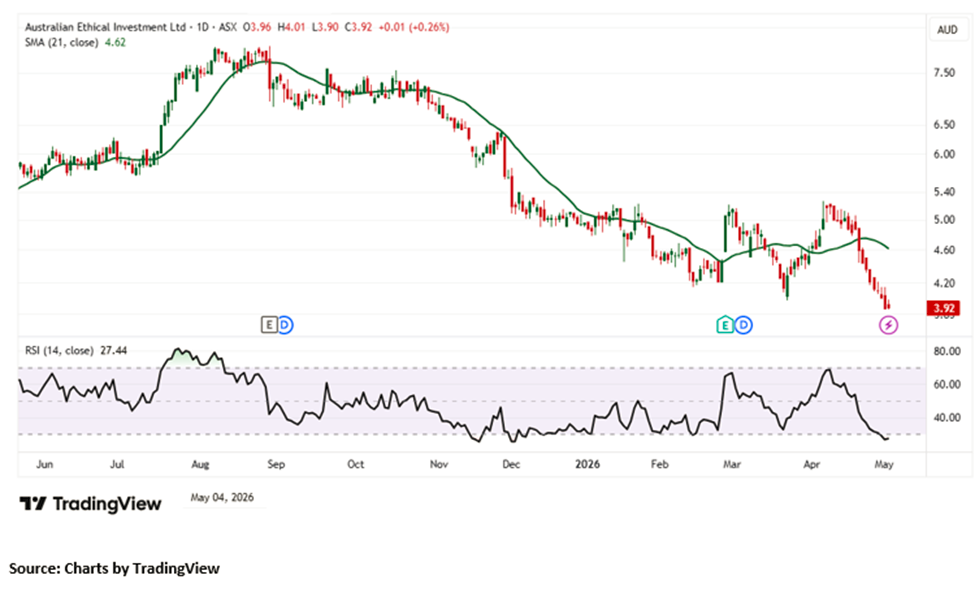
AEF is trading above a key horizontal support level, supported by a noticeable uptick in Volume, indicating improving buying interest and early signs of accumulation. The 14-day Relative Strength index (RSI) stands at 45.62, reflecting stabilizing momentum with room for a gradual recovery. Despite this, the stock continues to trade below its 21-day Moving Average, which is acting as a dynamic resistance and may cap near-term upside. Immediate support is seen at AUD 3.60 and AUD 3.40, while resistance levels are placed at AUD 4.20 and AUD 4.60. A sustained move above the 21-day Moving Average, would be needed to confirm strengthening bullish momentum. On the downside, a breach of the immediate support levels could trigger renewed selling pressure.
|
|
Outlook |
The outlook for Australian Ethical is structurally positive over the medium to long term. The three macro tailwinds are powerful and durable: compulsory Superannuation contribution growth as Australia's workforce expands and wages rise; increasing member choice participation as financial literacy grows; and rising ESG preference among younger Australian investors and super members. Each of these tailwinds operates independently of the Investment markets environment, providing a degree of FUM growth resilience even in poor returns years.
The competitive threat from 'Greenwashing' -- major fund managers launching ESG products of questionable authenticity -- is both a risk and an opportunity for Australian Ethical. As ESG claims proliferate and regulatory scrutiny of those claims intensifies (ASIC has been active in pursuing misleading ESG disclosures), the value of Australian Ethical's verified, 30-year ethical track record increases. The company is positioned to be a beneficiary of ESG credibility scrutiny rather than a victim of it.
|
|
Frequently Asked Questions |
Q: What makes Australian Ethical different from other ESG fund managers?
A: Its 30+ year heritage as a dedicated ethical manager (founded 1986), a published binding Ethical Charter that operationally constrains Investment decisions, and a track record of applying genuine screens before ESG became mainstream. This differentiation is increasingly valuable as Greenwashing scrutiny increases.
Q: How does Australian Ethical generate Revenue?
A: Through management fees calculated as a percentage of funds under management (FUM). Revenue grows as FUM grows -- driven by super contributions from members, new member joins, and positive Investment returns. No performance fees are charged on core products.
Q: What are the key risks?
A: ESG Market Saturation as major fund managers launch competing products; FUM growth deceleration if member Acquisition Investment does not deliver; Investment performance risk (poor returns in core strategies could trigger member redemptions); and regulatory complexity and cost of operating an APRA-regulated Superannuation fund.


 Nov 11, 2026





 Please wait processing your request...