
 CA
 NZ
 UK
 US
 IND

 AU

 Share
 X (Formerly Twitter)
 Whatsapp
 Facebook
 LinkedIn
 Telegram
 Email This Article
 Copy Link
 Summarize with AI
 Chat GPT
 Perplexity

Highlights
- WTI crude oil traded at USD 101.66, rising 0.41% during the session.
- The daily session opened at USD 101.29 and ranged between USD 100.60 and USD 101.76.
- The Daily Chart shows a recovery from the July area near USD 68.
- Prices recently approached USD 104–105 before consolidating.
- Oil Supply policy and geopolitical disruptions remain important market variables.
- USD 100 is a nearby technical area, with USD 105 an upside reference.
WTI crude oil traded near USD 101.66 on 27 October 2026, advancing 0.41% as the market held above the psychologically important USD 100 level. The daily chart reflects a substantial recovery from July lows, although recent candles show that the move has paused near the latest highs. Supply risks, producer decisions, refinery activity and global Demand expectations remain important for the broader oil market. The current price area therefore sits between a renewed advance and a period of consolidation.
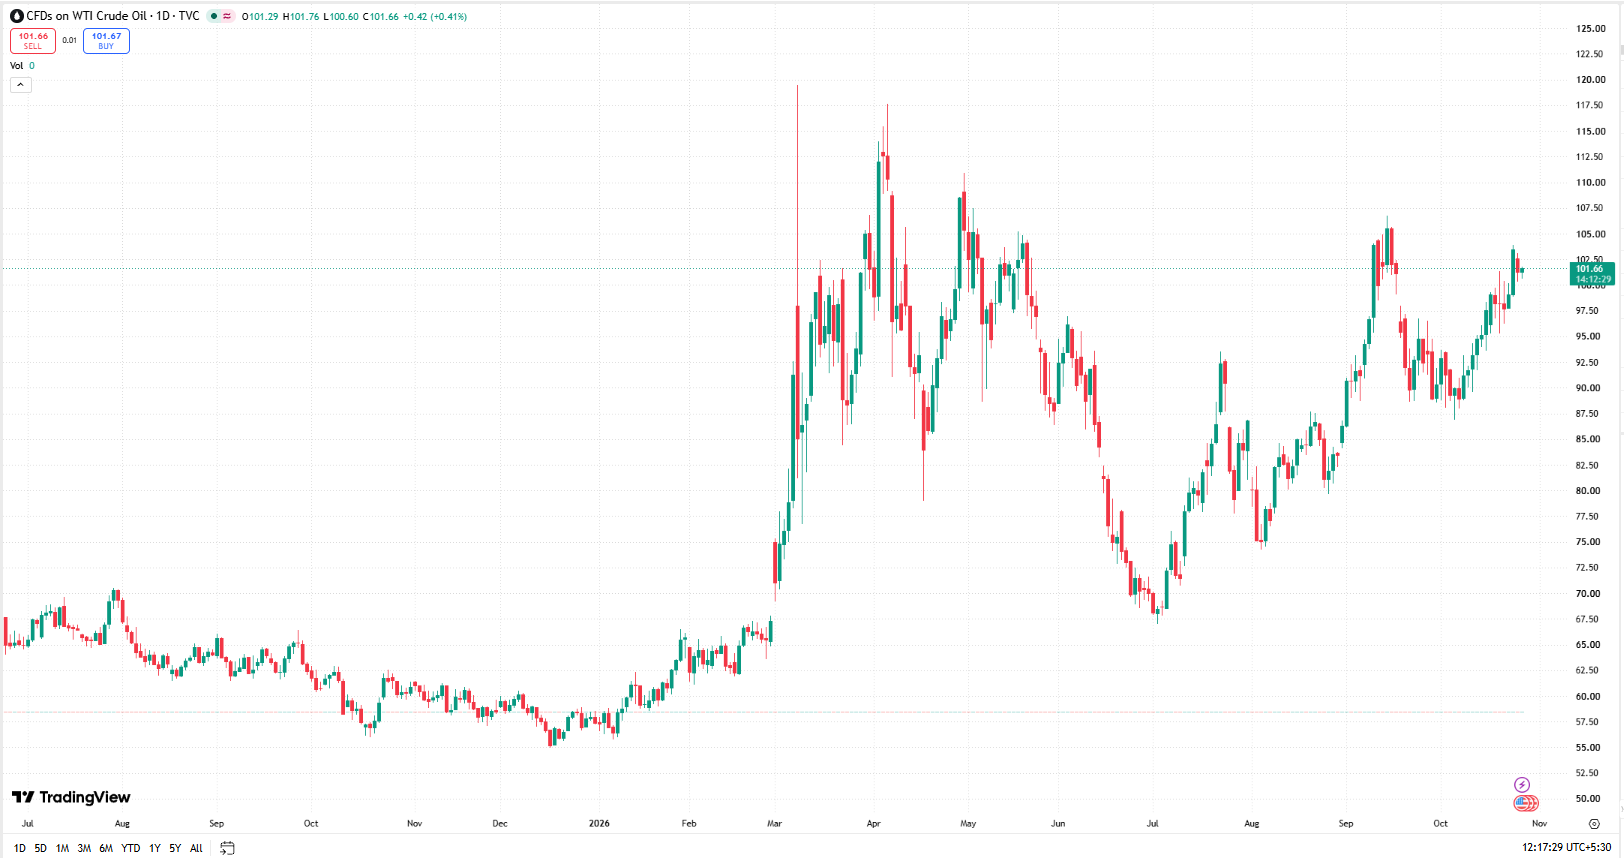
Source:TradingView chart, 27 October 2026
Producer Policy Remains Central to Supply Expectations
Crude supply expectations depend partly on production decisions by OPEC+ members and other major exporters. Changes in output targets, actual production and compliance can alter the amount of oil available to the market. At the same time, production growth outside the group can offset restrictions elsewhere. Traders also monitor inventories to assess whether current supply is meeting refinery requirements. Without fresh verified production figures, the direction of the supply balance cannot be established from the price chart alone.
Geopolitical Risks Keep Transport Routes in Focus
Energy prices remain sensitive to disruptions affecting producing regions, export terminals and major shipping corridors. Shipping delays or higher transport costs can tighten the supply of immediately available crude, even when underlying production capacity remains intact. Conversely, uninterrupted flows can reduce the risk premium attached to oil. These risks help explain why geopolitical developments remain important alongside conventional measures of supply and demand.
Economic Growth and Refinery Demand Matter
Crude demand is linked to industrial activity, freight movement, road transport and refinery operations. Economic growth in major consuming regions can support consumption, while slower Manufacturing or weaker fuel demand can reduce requirements. Interest-rate expectations and the US dollar also influence financial conditions and Commodity positioning. Weekly inventory releases and refinery utilisation data provide more direct evidence of short-term market balance than price movements alone.
Technical Outlook
WTI opened at USD 101.29, reached USD 101.76 and touched USD 100.60 before trading at USD 101.66. The chart shows a strong advance from around USD 68 in July towards USD 105 in September, followed by a pullback and a renewed climb in October. Recent price action is clustered near USD 100–103. A sustained break above USD 105 would move attention towards higher prior trading areas, while a retreat below USD 100 could expose USD 97.50 and USD 95. The chart does not display a 21-day SMA or 14-day RSI, so neither reading is reported.
Key Levels to Watch
The nearest downside reference is USD 100, followed by approximately USD 97.50 and USD 95. Upside reference areas are USD 103 and USD 105, with USD 107.50 beyond. These are approximate visual chart zones, not calculated pivot levels.
WTI crude oil remains near USD 101.66 after recovering substantially from midyear lows. Its position above USD 100 keeps the recent advance in focus, while the USD 103–105 region remains an important test. Producer decisions, inventory trends, geopolitical shipping risks and economic demand indicators will remain central to the next move.


 Nov 12, 2026





 Please wait processing your request...