
 CA
 NZ
 UK
 US
 IND

 AU

 Share
 X (Formerly Twitter)
 Whatsapp
 Facebook
 LinkedIn
 Telegram
 Email This Article
 Copy Link
 Summarize with AI
 Chat GPT
 Perplexity

Highlights
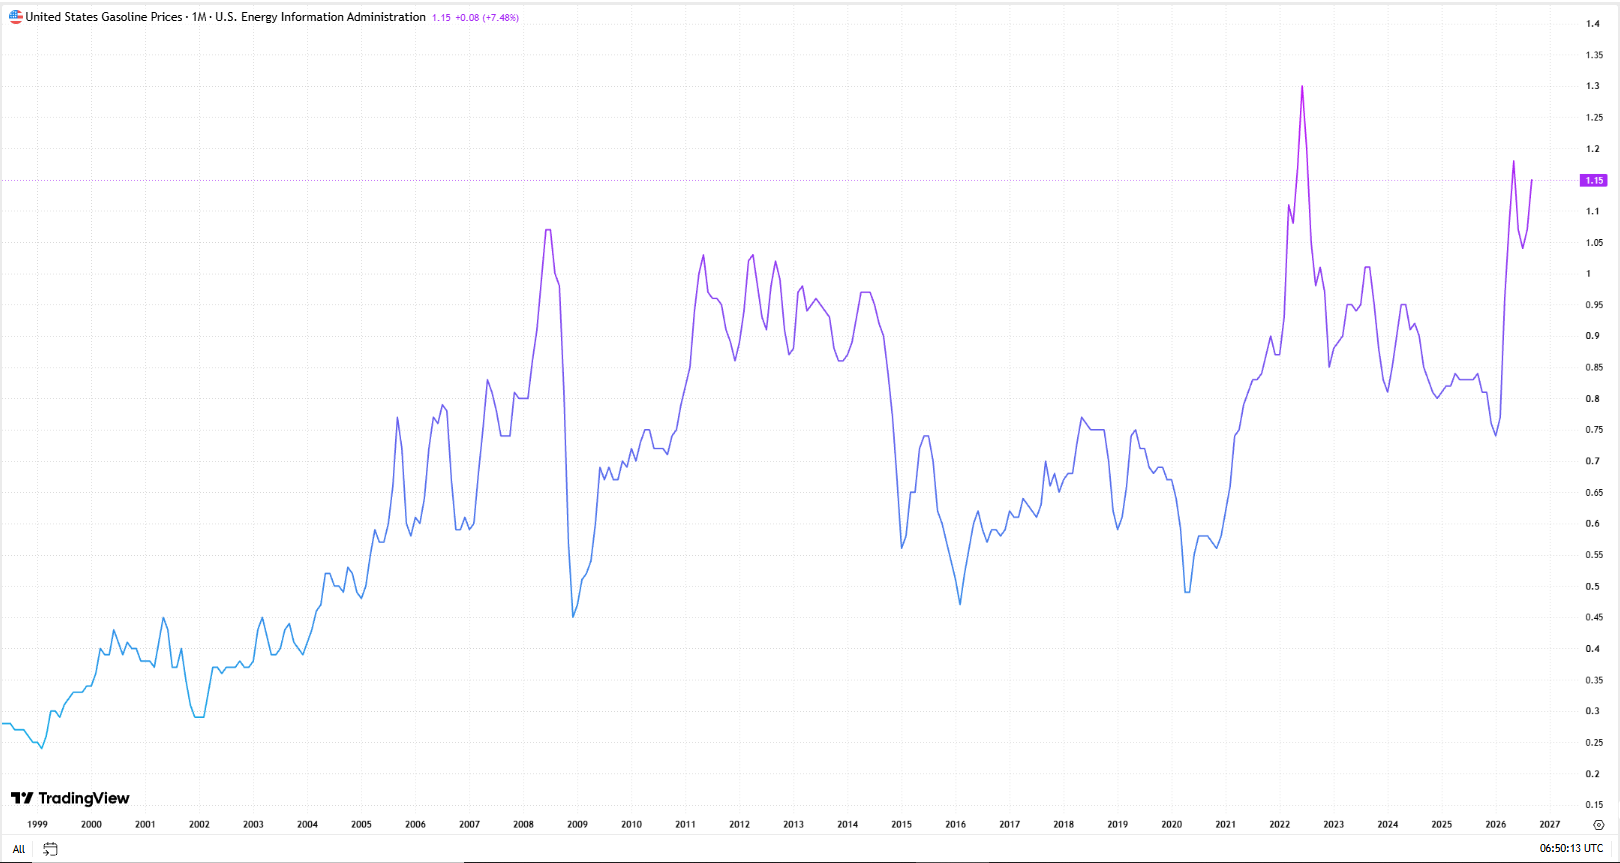
- The displayed US gasoline price series stood at 1.15, up 0.08 or 7.48%.
- The supplied TradingView series is monthly rather than daily.
- The latest plotted value approaches the prior 2026 highs.
- The long-term chart shows a notable spike near 1.30 during 2022.
- Crude oil prices, refinery capacity and driving Demand affect gasoline markets.
- The chart shows approximate reference areas at 1.05 and 1.20.
The supplied monthly United States gasoline price series stood at 1.15, an increase of 0.08 or 7.48% from the preceding observation. The TradingView chart attributes the series to the US Energy Information Administration and shows a renewed rise following a period of weaker readings. Unlike the daily energy price charts, this is a monthly historical series. Its display does not specify the price unit or the precise observation period, so the 1.15 reading is presented as shown rather than interpreted as a retail pump price or a futures quote.
Source:TradingView chart, 27 October 2026
Crude Oil Costs Influence Fuel Pricing
Crude oil is a major input for gasoline production, making global crude prices an important driver of refinery costs. However, gasoline prices do not move one-for-one with crude. Refining margins, product specifications, distribution expenses and taxes can all affect the final price paid by consumers. The chart shows changes in the supplied series but does not identify which cost component explains the latest increase.
Refinery Supply and Maintenance Matter
Gasoline availability depends on refinery throughput, operating reliability and the ability to move finished fuel to consuming markets. Seasonal maintenance, unplanned outages and regional transport constraints can reduce supply. Refineries also balance gasoline production against distillate and other product demand. Inventory releases can help establish whether supply is tight or ample relative to consumption, but no accompanying current inventory figures were provided with this chart.
Driving Demand and Economic Activity Remain Relevant
Road travel and commuting are central sources of gasoline demand. Consumption can change with driving patterns, economic activity, vehicle efficiency and seasonal travel. A rise in the displayed monthly price series does not independently establish stronger demand; reduced supply or higher crude costs could also contribute. Broader economic conditions, including consumer spending and interest rates, can influence fuel consumption indirectly.
Technical Outlook
The monthly chart places the latest series reading at 1.15, up 0.08 or 7.48%. It shows a long-term rise from low readings around 1999, a marked peak during 2022 near 1.30, and subsequent swings. Recent plotted values recovered from roughly 0.75 towards 1.15. Because this is a monthly line series rather than a daily candlestick chart, intraday opening prices, highs, lows and Volume cannot be reported. The chart also does not provide 21-day SMA or 14-day RSI readings. Momentum is best described here as a recent upward movement in the plotted series, not a confirmed daily trading signal.
Key Levels to Watch
On the monthly visual, nearby reference areas are approximately 1.05 and 1.00 below the current reading, with 0.85 further down. Upside reference areas are around 1.20 and the earlier 2022 high near 1.30. These are approximate visual levels on the supplied series and are not actionable futures support or resistance calculations.
The supplied US gasoline price series has risen to 1.15, with the monthly chart showing renewed strength. Crude input costs, refinery operations, inventories and road-fuel demand remain important context. The exact series definition and units should be verified before comparing the plotted value with consumer pump prices or other gasoline benchmarks.


 Nov 12, 2026





 Please wait processing your request...