
 CA
 NZ
 UK
 US
 IND

 AU

 Share
 X (Formerly Twitter)
 Whatsapp
 Facebook
 LinkedIn
 Telegram
 Email This Article
 Copy Link
 Summarize with AI
 Chat GPT
 Perplexity

Highlights
- Silver traded at USD 52.82100 and fell 2.15% during the session.
- The metal opened at USD 53.93650 and reached USD 54.23600.
- The session low was USD 52.71700, versus a previous close of USD 53.98000.
- Reported tick Volume stood near 101.25K ticks.
- The chart shows a sequence of lower recovery peaks after its January high.
- Traders are watching support around USD 52 and USD 50 and resistance near USD 56 and USD 60.
Silver traded near USD 52.82100 on 27 October 2026 as investors balanced the latest market move against monetary-policy expectations and changing Commodity fundamentals. The session opened at USD 53.93650, while prices ranged from USD 52.71700 to USD 54.23600. The Daily Chart places this move in a broader context of pronounced volatility, with price direction increasingly dependent on the dollar, global growth expectations and the market's response to upcoming US policy signals.
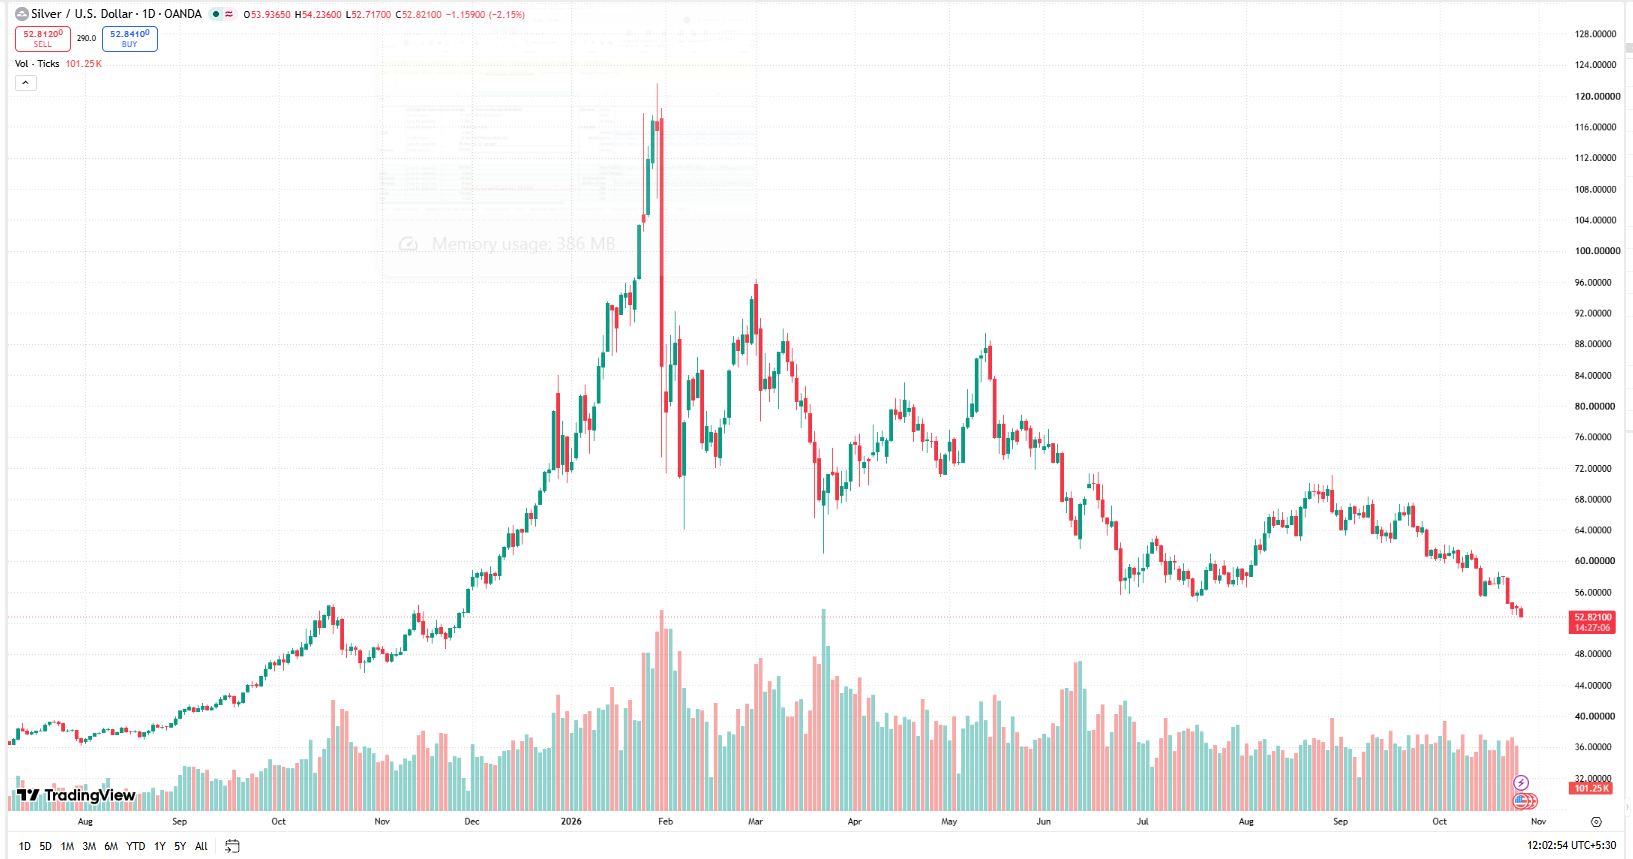
TradingView chart, 27 October 2026
Federal Reserve Expectations Add Pressure
Silver has weakened alongside gold as a firmer dollar and higher-rate expectations weigh on precious metals. Investors are awaiting the Federal Reserve’s October policy decision and subsequent US Inflation indicators. Because silver does not pay interest, rising yields can reduce its relative appeal.
Industrial Exposure Adds Another Dimension
Unlike gold, silver also has substantial industrial applications, including electronics and solar-related manufacturing. That makes the metal sensitive to expectations for factory activity and capital investment. Concerns about Manufacturing Demand can amplify price weakness during periods when monetary conditions are already restrictive.
Supply Tightness Meets Softer Sentiment
Physical Supply constraints have offered an underlying counterweight to silver’s recent losses, but they have not prevented pronounced volatility. The metal’s sharp Reversal from its early-year highs shows how rapidly financial positioning and macroeconomic expectations can dominate near-term price action. Changes in industrial orders and inventory conditions remain relevant to any recovery.
Technical Outlook
Silver was quoted at USD 52.82100, against an opening level of USD 53.93650, an intraday high of USD 54.23600 and a low of USD 52.71700. The previous close was USD 53.98000, and displayed volume was approximately 101.25K ticks. The daily chart shows a sequence of lower recovery peaks after its January high, following the January surge above USD 115. Recent candles indicate that traders are testing whether the current zone can hold after earlier swings. A sustained break above nearby resistance would strengthen the recovery case; failure to hold support would leave the market vulnerable to renewed selling. The supplied chart does not show numerical 21-day SMA or 14-day RSI values, so neither indicator is assigned an unverified reading.
Key Levels to Watch
The nearest chart-based support areas are approximately USD 52 and USD 50, while potential resistance is visible near USD 56 and USD 60. These are approximate visual zones, not calculated pivot levels. A move through either side would need confirmation in subsequent sessions to indicate whether the current trading range is changing.
Silver remains exposed to shifts in Federal Reserve expectations, US dollar direction and its own supply-demand balance. The latest price of USD 52.82100 reflects a market navigating technical levels and macroeconomic uncertainty. Attention now turns to policy communication, upcoming inflation data and whether price action can hold the nearby support area or recover through resistance.


 Nov 12, 2026





 Please wait processing your request...