
 CA
 NZ
 UK
 US
 IND

 AU

 Share
 X (Formerly Twitter)
 Whatsapp
 Facebook
 LinkedIn
 Telegram
 Email This Article
 Copy Link
 Summarize with AI
 Chat GPT
 Perplexity

Highlights
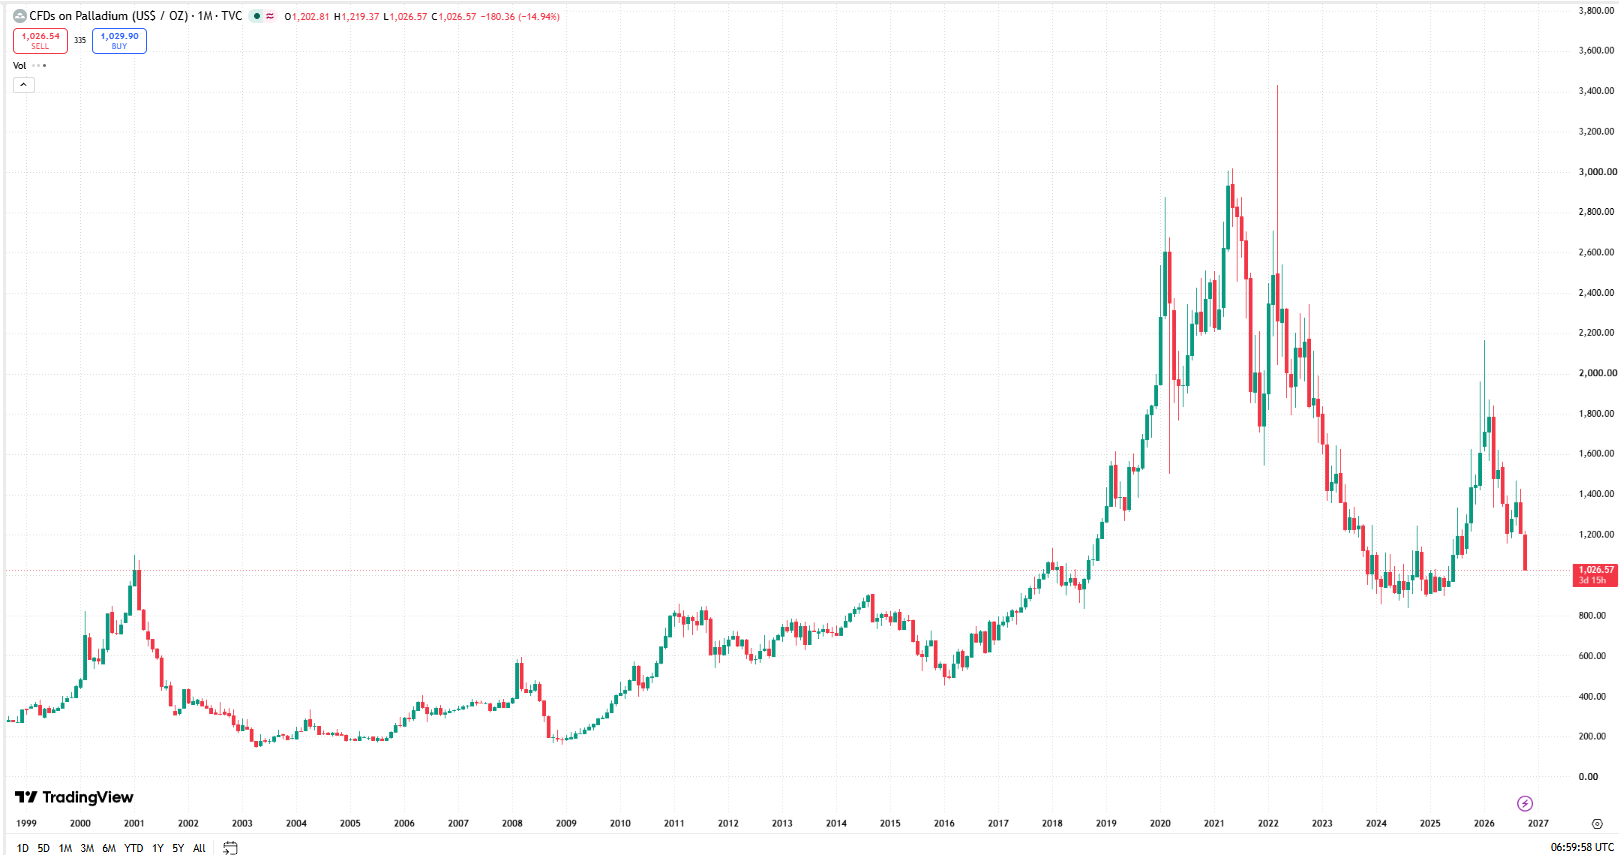
- Palladium was quoted at USD 1,026.57, changing −14.94% on the displayed monthly candle.
- The chart shows an open of USD 1,202.81 and a high of USD 1,219.37.
- The displayed low was USD 1,026.57.
- The longer chart depicts a retreat from the historical 2021–2022 highs and a renewed decline after the rebound shown in 2026.
- The first downside area to monitor is around USD 1,000.
- Initial upside attention falls around USD 1,200.
Palladium was quoted at USD 1,026.57 on the supplied TradingView screenshot, with a displayed change of −14.94%. The market picture is shaped by a retreat from the historical 2021–2022 highs and a renewed decline after the rebound shown in 2026. Technical levels provide a way to describe the current price structure, while production, consumption and financing conditions form the broader context. The screenshot supplies chart observations, not an independently verified explanation for the latest move. The distinction between the current Quotation and the wider trend remains important.
Source:TradingView chart, 27 October 2026
Vehicle Production and Substitution Influence Consumption
Palladium Demand is closely linked to gasoline-vehicle catalytic converters. The growth of battery-electric vehicles can reduce the number of vehicles needing these catalysts, while hybrids and conventional vehicles continue to use them. Automakers may also substitute platinum for palladium when engineering and cost conditions permit. These structural changes can influence demand without explaining every individual monthly price swing.
Concentrated Mine Supply Adds Another Variable
Mine production is concentrated in a relatively small number of producing regions, notably Russia and South Africa. Operational reliability, Investment decisions and the availability of recycled catalytic-converter material can influence the market balance. Supply concentration creates sensitivity to disruptions, but the supplied monthly chart does not establish that a new disruption occurred in the period shown.
Monthly Price Swings Reflect Broader Market Uncertainty
The US dollar, financing costs and expectations for industrial activity also affect investor interest in palladium. Because this is a monthly chart, its displayed change is a monthly-candle movement rather than an intraday move. The latest candle should therefore not be presented as a single-day collapse, and the longer-term pattern is more informative than a short-term trading interpretation.
Technical Outlook
The monthly chart displays an open at USD 1,202.81, a high of USD 1,219.37, a low of USD 1,026.57, and a latest reading of USD 1,026.57. The displayed change is −14.94%. In the broader view, the chart shows a retreat from the historical 2021–2022 highs and a renewed decline after the rebound shown in 2026. That pattern provides context for the nearby trading zones but does not guarantee that an apparent support or resistance level will hold. Neither a 21-day simple Moving Average nor a 14-day relative strength index is plotted, so exact values for those indicators cannot be verified. Because the image is monthly, levels should be interpreted on a longer horizon and not as intraday signals.
Key Levels to Watch
Approximate downside chart zones are USD 1,000, USD 900, USD 800. On the upside, USD 1,200, USD 1,400, USD 1,600 are areas to monitor. These are visually estimated chart zones, not calculated pivot points or guaranteed trading levels.
Palladium remains sensitive to shifts in its market backdrop, while the supplied chart highlights the importance of nearby price levels. At USD 1,026.57, the current reading should be assessed against the wider monthly pattern and the distinction between observed prices and unverified catalysts. Further direction will depend on whether the price sustains a move beyond nearby chart zones.


 Nov 12, 2026





 Please wait processing your request...