
 CA
 NZ
 UK
 US
 IND

 AU

 Share
 X (Formerly Twitter)
 Whatsapp
 Facebook
 LinkedIn
 Telegram
 Email This Article
 Copy Link
 Summarize with AI
 Chat GPT
 Perplexity

Highlights
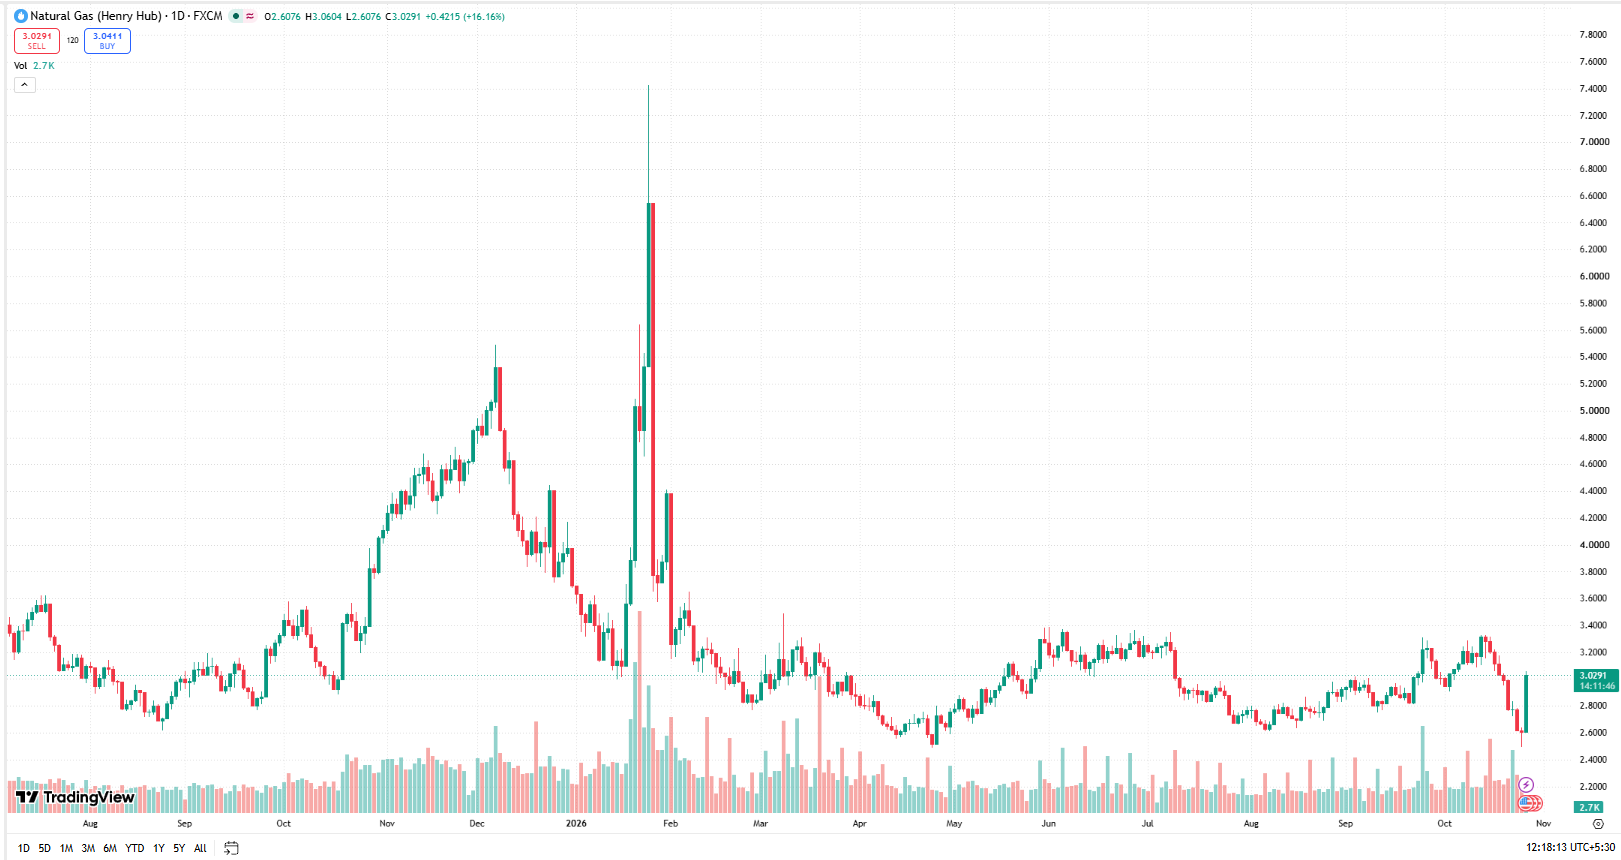
- Natural gas traded at USD 3.0291, gaining 16.16% on the displayed session.
- The price opened at USD 2.6076 and ranged from USD 2.6076 to USD 3.0604.
- The Daily Chart shows a sharp rebound from the recent USD 2.50–2.60 area.
- The market previously approached USD 3.30 during October.
- Weather forecasts, storage and LNG export Demand remain key variables.
- USD 3.20–3.30 is an upside area, while USD 2.60 is a downside reference.
Henry Hub Natural Gas rebounded sharply to USD 3.0291 on 27 October 2026, gaining 16.16% in the displayed session. The price moved from an opening level of USD 2.6076 to a high of USD 3.0604, recovering much of the preceding sell-off. The move follows a volatile year marked by pronounced winter spikes and a more contained trading range during spring and summer. Market attention remains on the interaction between weather-related demand, underground storage, domestic production and liquefied natural gas exports.
Source:TradingView chart, 27 October 2026
Weather Shifts Can Change Demand Quickly
Natural gas consumption can change rapidly when temperatures depart from seasonal norms. Colder weather increases heating requirements, while hot periods can lift gas-fired electricity generation where air-conditioning demand is strong. Forecast revisions therefore matter for near-term pricing, particularly around the transition into winter. The chart alone does not establish whether a specific forecast triggered the latest rise; it shows the size of the price response, not its confirmed cause.
Storage Inventories Provide a Key Balance Signal
US underground storage acts as a buffer between production and consumption. Larger inventories can soften the effect of temporary demand increases, while comparatively tight storage can make prices more sensitive to Supply interruptions or cold-weather forecasts. Weekly changes need to be evaluated against seasonal averages and prevailing weather conditions. The current screenshot contains no verified storage figures, so it cannot support a specific inventory surplus or Deficit claim.
LNG Exports and Production Influence Availability
US liquefied natural gas export demand links domestic gas markets to overseas conditions. Changes in terminal operations, international demand and shipping can affect how much US production remains available at home. At the same time, domestic drilling and pipeline capacity shape supply responsiveness. Strong output can offset higher demand, while outages or infrastructure constraints may tighten the balance. Both domestic and international developments remain relevant to the Henry Hub outlook.
Technical Outlook
Natural gas opened at USD 2.6076, reached USD 3.0604 and traded at USD 3.0291 after a session low of USD 2.6076. The daily chart shows a sharp recovery from around USD 2.50–2.60 following a decline from October highs near USD 3.30. Prices have returned above USD 3.00 but have not yet moved decisively above the prior USD 3.20–3.30 region. The chart also shows extreme Volatility earlier in 2026, making confirmation through subsequent sessions particularly relevant. No 21-day SMA or 14-day RSI values are displayed.
Key Levels to Watch
Immediate support lies around USD 3.00, followed by approximately USD 2.80 and USD 2.60. Upside reference areas are USD 3.10, USD 3.20 and USD 3.30. All levels are approximate visual chart zones rather than calculated indicators.
Natural gas has recovered to USD 3.0291 after a pronounced daily advance. Whether prices can remain above USD 3.00 and challenge the USD 3.20–3.30 region will help clarify near-term momentum. Weather, storage, production and LNG export flows remain the principal fundamental variables to monitor.


 Nov 12, 2026





 Please wait processing your request...