
 CA
 NZ
 UK
 US
 IND

 AU

 Share
 X (Formerly Twitter)
 Whatsapp
 Facebook
 LinkedIn
 Telegram
 Email This Article
 Copy Link
 Summarize with AI
 Chat GPT
 Perplexity

Highlights
- Heating oil traded at USD 4.7305, rising 0.25% in the session.
- The price opened at USD 4.7219 and moved between USD 4.6882 and USD 4.7351.
- The Daily Chart shows a strong advance from the July region near USD 3.10.
- A September peak near USD 5.10 was followed by consolidation.
- Distillate demand, refinery output and crude input costs remain important.
- USD 4.60 is nearby support, with USD 4.85–5.00 an upside area.
Heating oil traded near USD 4.7305 on 27 October 2026, gaining 0.25% as prices held within a relatively narrow daily range. The chart shows a strong rise from the July lows, followed by a retreat from September highs and a period of consolidation. Heating oil prices are sensitive to distillate supply, refinery operations, transportation fuel Demand and the cost of crude oil. With colder months approaching in the Northern Hemisphere, seasonal demand remains an important Factor to monitor.
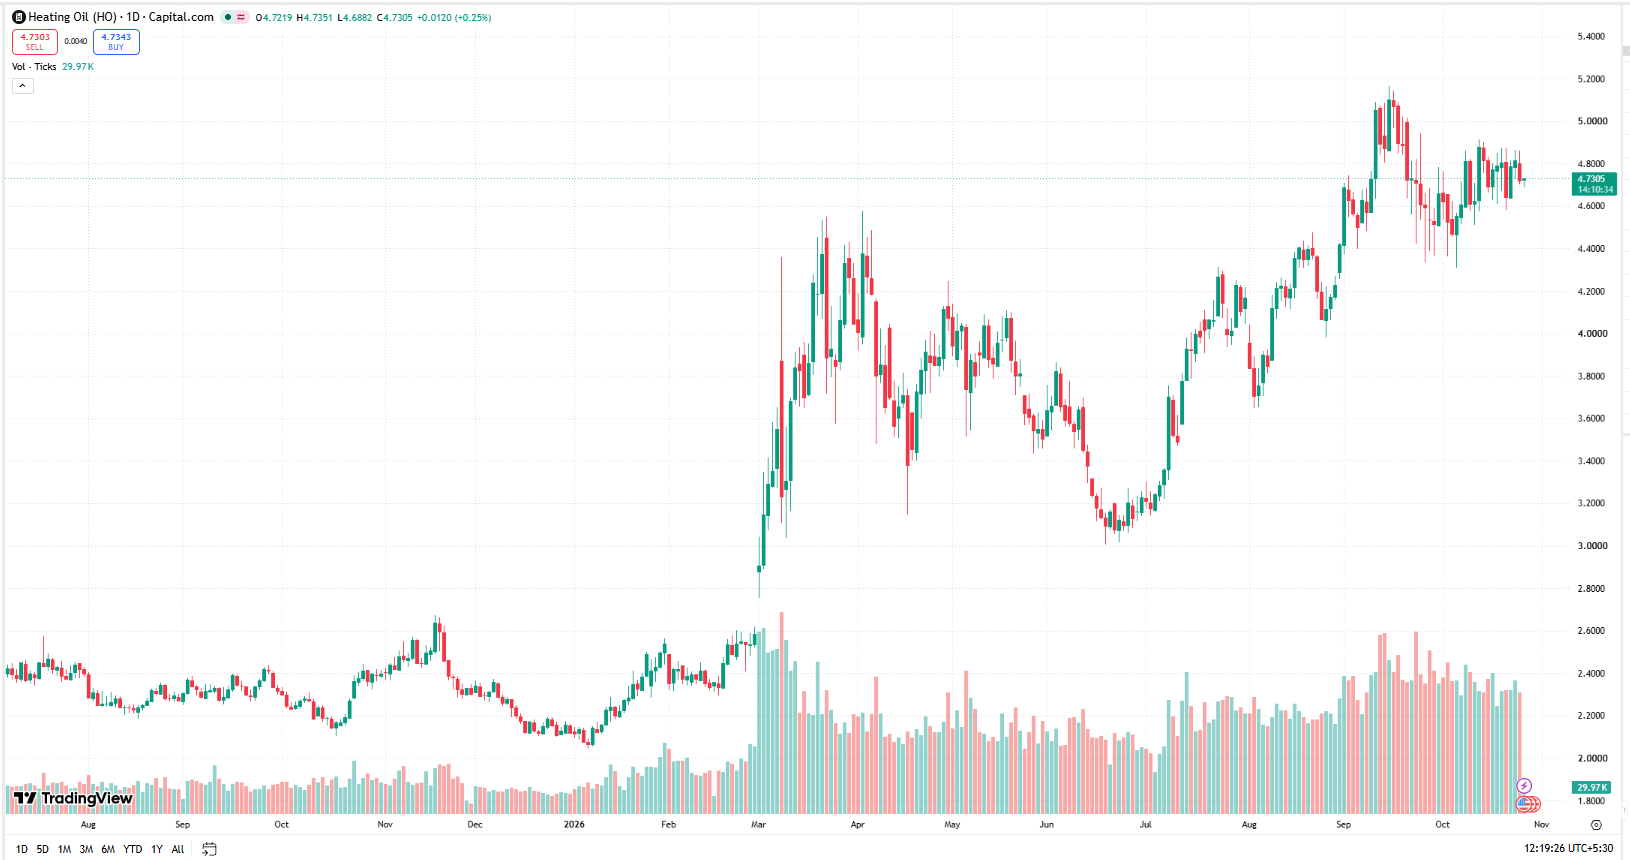
Source:TradingView chart, 27 October 2026
Seasonal Heating Demand Comes Into View
Heating oil is part of the broader middle-distillate market, which also includes diesel fuels used in transportation and industry. Demand can strengthen as colder weather raises heating requirements in regions where oil-fired systems remain in use. However, weather conditions and fuel substitution can vary substantially by region. Seasonal expectations can affect forward pricing, while actual consumption and inventory data determine whether anticipated demand is materialising.
Refinery Operations Shape Distillate Supply
Refineries produce heating oil and other distillates from crude feedstocks. Maintenance schedules, unexpected outages and changes in refinery utilisation can influence available fuel supplies. The product mix also matters: refiners may adjust output depending on margins and demand for gasoline, diesel and other fuels. Higher crude costs can lift input expenses, but product prices also reflect refinery margins and local availability. No current refinery throughput or inventory series is supplied with the chart.
Global Trade and Macroeconomic Conditions Matter
Distillate markets are connected through international shipping and trade. Disruptions affecting export routes, refining centres or fuel transport can create regional tightness. Meanwhile, industrial activity, freight demand and economic growth influence diesel consumption. Interest rates and currency movements can shape broader Commodity sentiment, but heating oil is also driven by specific physical-market conditions. These influences should be assessed alongside published inventory and demand data rather than inferred from one price move.
Technical Outlook
Heating oil opened at USD 4.7219, reached USD 4.7351 and fell as low as USD 4.6882 before trading at USD 4.7305. The daily chart shows a sustained advance from the July area near USD 3.10 towards a September peak around USD 5.10. A subsequent pullback brought prices towards USD 4.40, followed by consolidation around USD 4.60–4.85. The recent narrow candles suggest a pause within this range. A sustained move above USD 4.85 could reopen the USD 5.00 area, while weakness below USD 4.60 would shift attention towards USD 4.40. The chart does not provide 21-day SMA or 14-day RSI readings.
Key Levels to Watch
Approximate support areas are USD 4.60 and USD 4.40, with USD 4.20 lower down. Resistance is visible around USD 4.85, USD 5.00 and the previous peak near USD 5.10. These are chart-derived zones, not calculated pivot levels.
Heating oil remains near USD 4.7305 following a strong midyear advance and subsequent consolidation. Prices are now moving between nearby support around USD 4.60 and resistance near USD 4.85. Seasonal heating demand, refinery output, distillate inventories and Crude Oil prices will remain relevant to the next directional move.


 Nov 12, 2026





 Please wait processing your request...