This report is an updated version of the report published on 27 February 2026 at 10:30 AM AEDT.

Westgold Resources Limited (ASX: WGX)
Company Overview: Westgold Resources Limited (ASX: WGX) is a Western Australia-based gold explorer, developer, and miner focused on the Murchison and Southern Goldfields regions. The company holds tenure over more than 3,200 km² and operates underground mines along with processing plants. With a focus on sustainable mining practices, Westgold is committed to maximising the potential of its extensive resource base while contributing to the local economy.
Recommendation Rationale – SELL at AUD 7.88
- Technical Standpoint: WGX share price has surpassed the R1 level recommended on 9 February 2026. The 14-day RSI currently stands at approximately 62.68, nearing the overbought zone. This upward move raises the risk of short-term consolidation or downside retracement.
- Overvalued Multiples: On a forward 12-month basis – key trading multiples (EV/EBITDA, Price/Earnings, Price/Book, and Price/Cash Flow) are higher than median of the Basic Materials sector.
- Cost Inflation: During H1 FY26, AISC including OPA (ore purchase agreement) rose to AU$3,225/oz vs AU$2,562/oz pcp. Margins are increasingly dependent on elevated gold prices. Any pullback in gold could compress profitability quickly.
- Earnings Boost Largely Gold-Price Driven: In H1 FY26, WGX achieved gold price jumped to AU$5,877/oz vs AU$3,910/oz in H1 FY25. Revenue and EBITDA growth are price-driven, not purely operational improvement.
Daily Price Chart
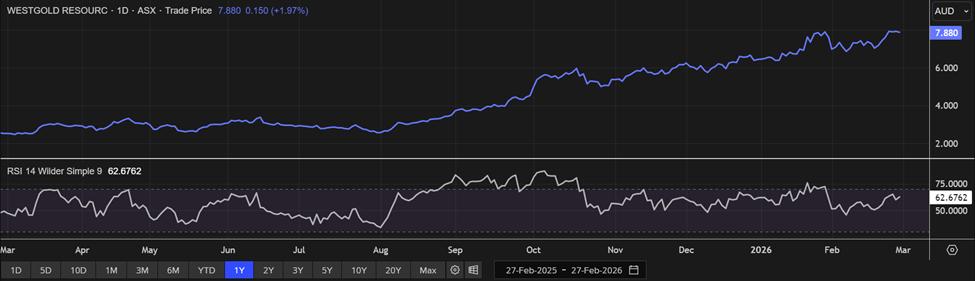
(Daily Technical Chart; Source: REFINITIV)
Valuation Methodology: Price/Cash Flow Multiple Approach (FY Jun'27E) (Illustrative)
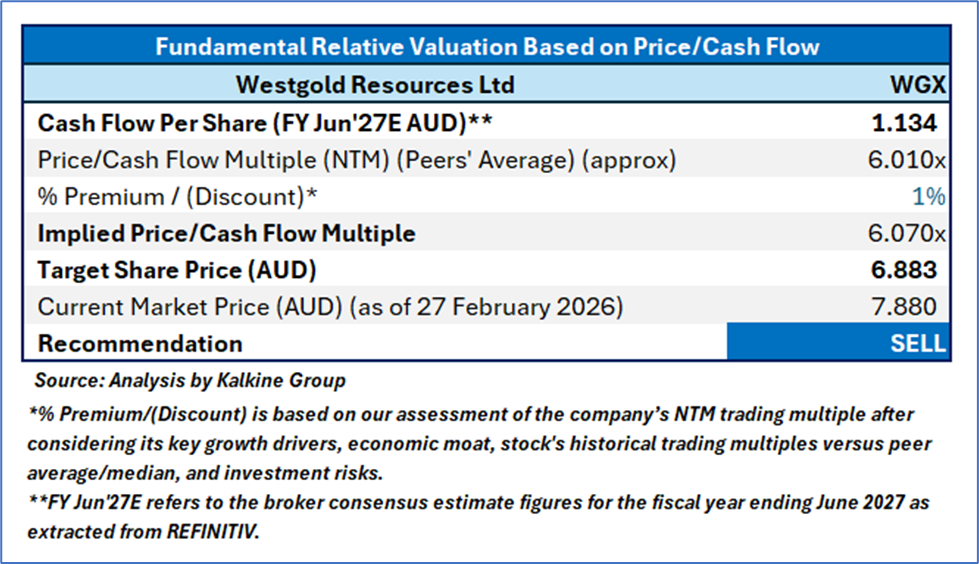
The stock might trade at a slight premium to peers given the 59% and 166% YoY growth in EBITDA and statutory profit before tax, respectively. For conducting the valuation, following peers have been considered - Resolute Mining Ltd (ASX: RSG), Perenti Ltd (ASX: PRN), and Fenix Resources Ltd (ASX: FEX).
WGX is trading near its 52-week high despite rising AISC, increased reliance on high-cost OPA production, and earnings that remain highly leveraged to elevated gold prices, reducing margin of safety at current levels. Given the stock has surpassed its R1 level, and risks associated, commodity price volatility, it is prudent to sell the stock at the current levels. Hence, a ‘Sell’ recommendation is given on the stock at the current market price of AUD 7.88, as of 27 February 2026, at 10:00 AM AEDT.
Markets are trading in a highly volatile zone currently due to certain macro-economic issues and prevailing geopolitical tensions. Therefore, it is prudent to follow a cautious approach while investing.
Note 1: Past performance is neither an indicator nor a guarantee of future performance.
Note 2: The reference date for all price data, currency, technical indicators, support, and resistance levels is 27 February 2026. The reference data in this report has been partly sourced from REFINITIV.
Note 3: Investment decisions should be made depending on an individual's appetite for upside potential, risks, holding duration, and any previous holdings. An 'Exit' from the stock can be considered if the Target Price mentioned as per the Valuation and or the technical levels provided has been achieved and is subject to the factors discussed above.
Note 4: Kalkine reports are prepared based on the stock prices captured either from REFINITIV or Trading View. Typically, REFINITIV or Trading View may reflect stock prices with a delay which could be a lag of 25-30 minutes. There can be no assurance that future results or events will be consistent with the information provided in the report. The information is subject to change without any prior notice.
Note 5: Dividend Yield may vary as per the stock price movement.
Technical Indicators Defined: -
Support: A level at which the stock prices tend to find support if they are falling, and downtrend may take a pause backed by demand or buying interest.
Resistance: A level at which the stock prices tend to find resistance when they are rising, and uptrend may take a pause due to profit booking or selling interest.
Stop-loss: In general, it is a level to protect further losses in case of any unfavourable movement in the stock prices.

 CA
 NZ
 UK
 US
 IND

 AU

 Please wait processing your request...