Aurora Cannabis Inc
Aurora Cannabis Inc. (NASDAQ: ACB) is a Canada-based medical cannabis company. The Company’s principal business lines are focused on the production, distribution and sale of cannabis and cannabis-derivative products in Canada and internationally. The Company’s segments include Cannabis and Plant Propagation. The Company's adult-use brand portfolio includes Drift, San Rafael '71, Daily Special, Tasty's, Being and Greybeard. Its medical cannabis brands include MedReleaf, CanniMed, Aurora and Whistler Medical Marijuana Co, as well as international brands, Pedanios, IndiMed and CraftPlant.
Key Business and Financial Updates:
- Aurora Cannabis Q1 Fiscal 2026 Financial Performance Overview: Aurora Cannabis Inc. (NASDAQ: ACB) announced its financial and operational results for the first quarter of fiscal 2026, ending June 30, 2025, on August 6, 2025, reporting a 17% year-over-year increase in total net revenue to CAD 98.0 million, driven by a 37% surge in global medical cannabis net revenue to CAD 64.8 million. The company achieved a significant 209% growth in Adjusted EBITDA to CAD 10.8 million and a 42% rise in positive free cash flow to CAD 9.2 million, reflecting robust operational efficiency and financial discipline. This performance was underpinned by an 85% increase in international medical cannabis revenue to CAD 37.1 million, particularly in markets like Germany and Poland, alongside a strong balance sheet with approximately CAD 186.0 million in cash and a debt-free cannabis business, excluding CAD 59.8 million in non-recourse debt related to Bevo Farms Ltd.
- Segment-Wise Revenue and Margin Analysis: The medical cannabis segment, contributing 66% of total net revenue and 91% of adjusted gross profit before fair value adjustments, saw its net revenue grow by CAD 17.6 million, fueled by expanded sales in Australia, Germany, Poland, and the UK, as well as increased Canadian insurance-covered patient revenue, with adjusted gross margins improving from 67% to 69% due to cost reductions and production efficiencies. Conversely, consumer cannabis net revenue declined 32% to CAD 7.9 million due to a strategic shift toward higher-margin medical products, though adjusted gross margins rose from 20% to 33% through cost efficiencies. The plant propagation segment, dominated by Bevo, reported a modest 4% revenue increase to CAD 23.9 million, but adjusted gross margins dropped from 18% to 6% due to CAD 1.6 million in inventory write-offs, though excluding these costs, the margin was 14%, indicating seasonal variability and ongoing expansion efforts.
- Operational Efficiency and Future Expectations: Aurora Cannabis demonstrated operational strength with a 52% adjusted gross margin before fair value adjustments on total net revenue, up from 42% in the prior year, supported by sustainable cost reductions and higher selling prices, despite a CAD 37.4 million rise in Adjusted SG&A expenses due to increased freight and logistics costs from European sourcing. The company’s net loss from continuing operations widened to CAD 19.4 million from a CAD 3.5 million profit, reflecting a CAD 15.0 million gross profit decline and higher operating expenses, yet the positive Adjusted EBITDA and free cash flow underscore a shift toward profitability. For Q2 2026, Aurora anticipates consolidated net revenue growth of 8% to 12%, driven by medical cannabis, with adjusted gross margins expected to improve by 250 to 475 basis points, and annual positive free cash flow for the second consecutive year, though Q2 may see significant cash outflows due to historical trends.
- Balance Sheet Strength and Market Positioning: The company maintains a robust balance sheet with total assets of CAD 837.8 million and working capital of CAD 308.4 million as of June 30, 2025, despite a 16% decrease from the prior quarter due to inventory adjustments, and cannabis inventory and biological assets grew 14% to CAD 195.6 million, reflecting operational scale. Aurora’s debt-free cannabis business, supported by a strong cash position, positions it favorably against peers, with Executive Chairman and CEO Miguel Martin highlighting the 57% international medical cannabis revenue share as a high-margin differentiator and Bevo’s diversification adding momentum through organic growth. This financial stability, combined with a focus on global medical markets, supports Aurora’s strategy to sustain profitable growth and investor confidence.
- Strategic Outlook and Investor Considerations: Aurora’s leadership expressed confidence in its platform’s competitive edge, with plans to leverage its international medical cannabis growth and plant propagation strengths to maintain positive annual free cash flow, targeting operational excellence amid market challenges as of August 6, 2025. The company’s strategic pivot toward higher-margin medical cannabis and cost management initiatives, despite a net loss and seasonal plant propagation pressures, suggests a balanced approach to long-term value creation. However, investors should note the risks of inventory misstatements from prior fiscal adjustments and potential cash flow volatility in Q2 2026, necessitating careful evaluation of its financial trajectory and market positioning.
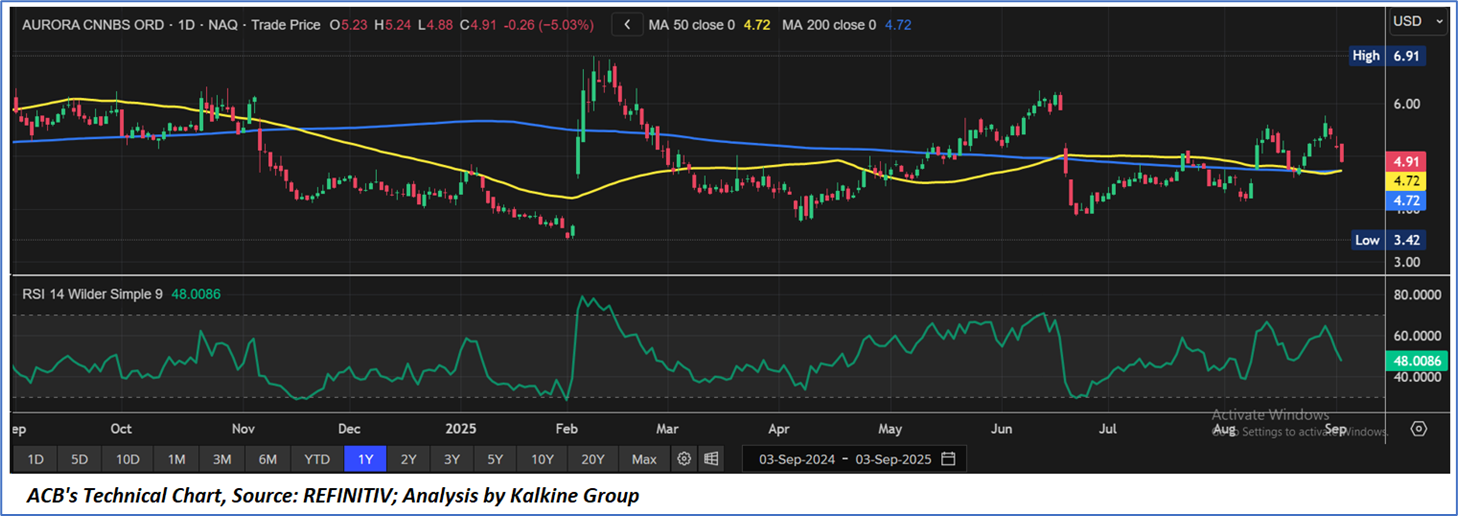
Technical Observation (on the daily chart):
The Relative Strength Index (RSI) over a 14-day period stands at a value of 48.01, downward trending, with expectations of a consolidation or a downward correction if the stock price breaks the important support of USD 4.00-USD 4.50. Additionally, the stock's current positioning is above both the 50-period SMA and 200-period SMA, which may serve as dynamic short to medium-term support levels.
Aurora Cannabis Inc reported its financial and operational results for the first quarter of fiscal 2026, ending June 30, 2025, with total net revenue increasing 17% year-over-year to CAD 98.0 million, driven by a 37% rise in global medical cannabis net revenue to CAD 64.8 million, though consumer cannabis revenue fell 32% to CAD 7.9 million due to a strategic shift. The company achieved a 209% increase in Adjusted EBITDA to CAD 10.8 million and a 42% growth in positive free cash flow to CAD 9.2 million, reflecting operational efficiency, supported by an 85% jump in international medical cannabis revenue to CAD 37.1 million, particularly in Germany and Poland, while maintaining a strong balance sheet with CAD 186.0 million in cash, excluding CAD 59.8 million in non-recourse debt. However, a net loss from continuing operations widened to CAD 19.4 million from a CAD 3.5 million profit, and plant propagation revenue grew modestly by 4% to CAD 23.9 million with adjusted gross margins dropping to 6% due to inventory write-offs, with Q2 2026 projections indicating 8% to 12% revenue growth and potential cash flow challenges, suggesting a balanced outlook amid operational strengths and financial risks as of September 04, 2025.
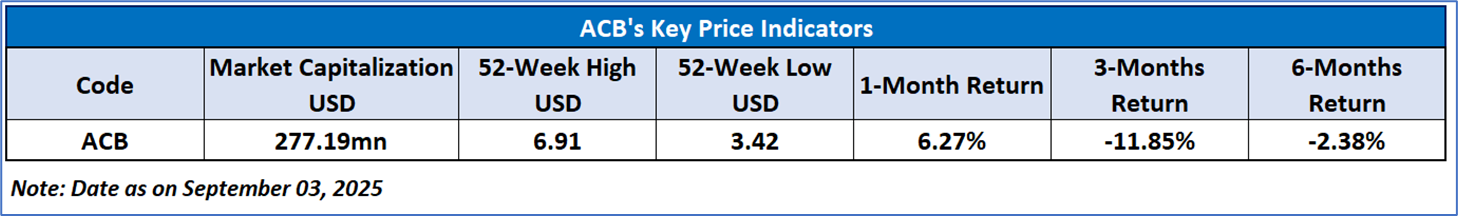
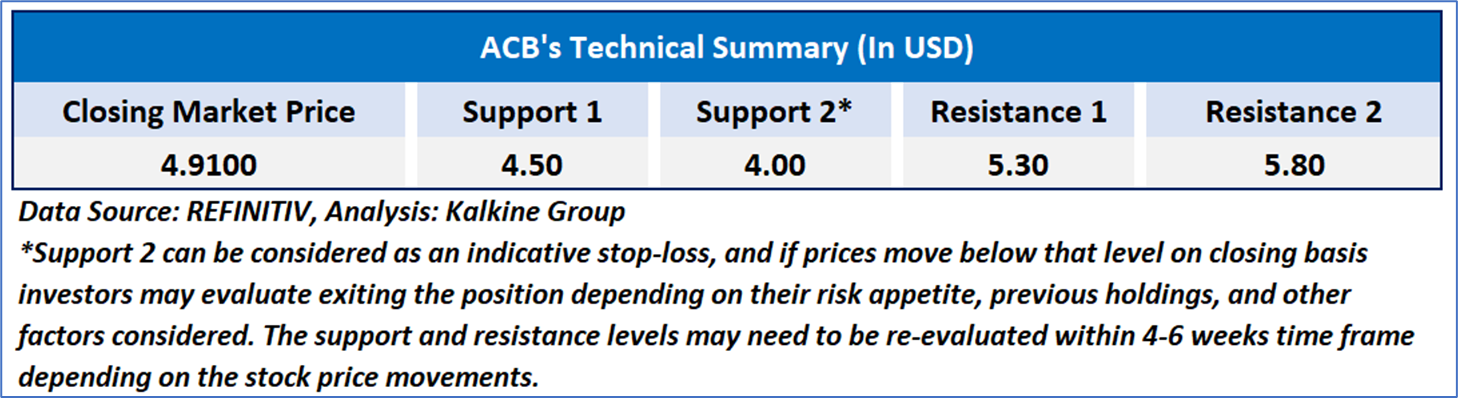
As per the above-mentioned price action, important resistance near USD 16.00-USD17.00, momentum in the stock over the last month, and technical indicators analysis, a ‘WATCH’ rating has been given for Aurora Cannabis Inc. (NASDAQ: ACB) at the closing price of USD 4.91, as of September 03, 2025.
Individuals can evaluate the stock based on the support and resistance levels provided in the report in case of keen interest taking into consideration the risk-reward scenario.
Markets are trading in a highly volatile zone currently due to certain macro-economic issues and prevailing geopolitical tensions. Therefore, it is prudent to follow a cautious approach while investing.
Related Risk: This report may be looked at from a high-risk perspective and a recommendation is provided for a short duration. This report is solely based on technical parameters, and the fundamental performance of the stocks has not been considered in the decision-making process. Other factors which could impact the stock prices include market risks, regulatory risks, interest rates risks, currency risks, social and political instability risks etc.
Note 1: Past performance is not a reliable indicator of future performance.
Note 2: The reference date for all price data, currency, technical indicators, support, and resistance level is September 03, 2025. The reference data in this report has been partly sourced from REFINITIV.
Note 3: Investment decisions should be made depending on an individual's appetite for upside potential, risks, holding duration, and any previous holdings. An 'Exit' from the stock can be considered if the Target Price mentioned as per the Valuation and or the technical levels provided has been achieved and is subject to the factors discussed above.
Note 4: Target Price refers to a price level that the stock is expected to reach as per the relative valuation method and or technical analysis taking into consideration both short-term and long-term scenarios.
Note 5: ‘Kalkine reports are prepared based on the stock prices captured either from the New York Stock Exchange (NYSE), NASDAQ Capital Markets (NASDAQ), and or REFINITIV. Typically, all sources (NYSE, NASDAQ, or REFINITIV) may reflect stock prices with a delay which could be a lag of 15-20 minutes. There can be no assurance that future results or events will be consistent with the information provided in the report. The information is subject to change without any prior notice.
 AU
AU

 Please wait processing your request...