VAALCO Energy Inc
VAALCO Energy Inc (NYSE: EGY) founded in 1985 and incorporated under the laws of Delaware, is a Houston, Texas, USA based, independent energy company with a diverse portfolio of production, development and exploration assets across Gabon, Egypt, Côte d'Ivoire, Equatorial Guinea, Nigeria and Canada.

Key Business and Financial Updates:
Operational Performance and Production Trends: Vaalco Energy reported third quarter 2025 production of 15,405 net revenue interest (NRI) BOEPD, at the high end of guidance, equivalent to 19,887 working interest BOEPD, above the midpoint of expectations. NRI sales volumes totaled 1.18 million BOE, down 33% sequentially due primarily to a planned full-field maintenance shutdown in Gabon during July. Average realized prices declined to USD 51.26 per BOE, compared to USD 54.87 per BOE in Q2 2025 and USD 65.41 per BOE in Q3 2024, reflecting softer commodity pricing. Despite lower sales volumes, management increased full-year 2025 production and sales guidance midpoints based on strong year-to-date operational execution.
Financial Results and Earnings Profile: For Q3 2025, Vaalco generated net income of USD 1.1 million (USD 0.01 per diluted share), compared to USD 8.4 million in Q2 2025 and USD 11.0 million in Q3 2024. Adjusted EBITDAX was USD 23.7 million, down from USD 49.9 million in Q2 2025 and USD 92.8 million in Q3 2024, primarily driven by lower realized prices and reduced sales volumes. Net revenue declined 37% quarter-over-quarter to USD 61.0 million. Production expenses, excluding offshore workovers and stock compensation, fell to USD 29.8 million, reflecting lower activity in Côte d’Ivoire and Gabon, while DD&A declined 27% sequentially to USD 20.6 million. Income tax benefit totaled USD 3.6 million, influenced by deferred tax adjustments and oil price allocation effects in Gabon.
Asset-Level Operational Developments: In Gabon, the Company completed a planned maintenance turnaround without safety or environmental incidents and expects its 2025/2026 drilling program to commence in late November. In Egypt, development and exploration drilling progressed with multiple wells completed in the Eastern and Western Desert, supporting production stability. Côte d’Ivoire’s Baobab FPSO refurbishment continues in Dubai, with drilling expected in 2026 following vessel redeployment. In Canada, capital allocation was moderated with a shift toward lower-cost optimization projects, while in Equatorial Guinea, the Company advanced engineering studies for the Venus field development concept.
Capital Allocation, Liquidity, and Hedging Strategy: Third quarter capital expenditures totaled USD 48.3 million on a cash basis, below guidance, contributing to a 19% reduction in the full-year capital guidance midpoint from original 2025 levels. As of September 30, 2025, unrestricted cash stood at USD 24.0 million, with USD 60.0 million drawn under the new reserves-based revolving credit facility. Subsequent borrowing base redeterminations increased commitments to USD 240 million effective January 2026, enhancing liquidity flexibility. The Company maintained a quarterly dividend of USD 0.0625 per share and continued its rolling hedging program, with approximately 500 MBbls of remaining 2025 oil production hedged at an average floor price near USD 61 per barrel and approximately 800 MBbls hedged for the first half of 2026 at around USD 62 per barrel.
2025 Guidance and Strategic Outlook: For full-year 2025, Vaalco now expects NRI production between 15,900 and 16,910 BOEPD and capital expenditures between USD 225 million and USD 260 million. Production expense guidance remains in the range of USD 152–158 million, with NRI production expense projected at USD 24–26 per BOE. Fourth quarter 2025 production guidance ranges from 15,600 to 17,300 NRI BOEPD, with anticipated capital expenditures of USD 90–110 million. Management emphasized disciplined capital deployment, cost control, and preparation for multi-country drilling campaigns as the foundation for medium-term production growth and enhanced portfolio resilience amid commodity price volatility.
Key Company specific risks for EGY:
- Commodity Price and Market Exposure Risk: EGY’s revenue and profitability are highly sensitive to fluctuations in crude oil and gas prices. Lower realized pricing, even with stable production volumes, can materially compress net revenue, EBITDAX, and cash flow—as evidenced by year-over-year and sequential declines in realized prices in Q3 2025. Prolonged periods of weak oil prices reduce cash inflows, strain operational margins, and can limit reinvestment capacity.
- Operational and Production Volatility: The company’s production levels are influenced by field maintenance schedules, facility reliability, and drilling campaign timing. Planned turnarounds, rig availability constraints (particularly in Gabon), and deferred drilling in Canada illustrate operational execution risk. Delays or disruptions in drilling programs, FPSO refurbishments, or field startups can depress NRI production and undermine near-term volume realization.
- Liquidity, Capital Allocation, and Balance Sheet Risk: Although EGY strengthened liquidity through a reserves-based credit facility, capital expenditures remain elevated across its diversified asset base, including Gabon, Côte d’Ivoire, and Egypt. Significant capital commitments, borrowing base redeterminations, and lower working capital compared to prior periods introduce refinancing and cash flow sensitivity risks. The ability to sustain dividends, fund drilling campaigns, and manage debt obligations remains contingent on commodity prices and disciplined capital allocation.
Technical Observation (on the daily chart):
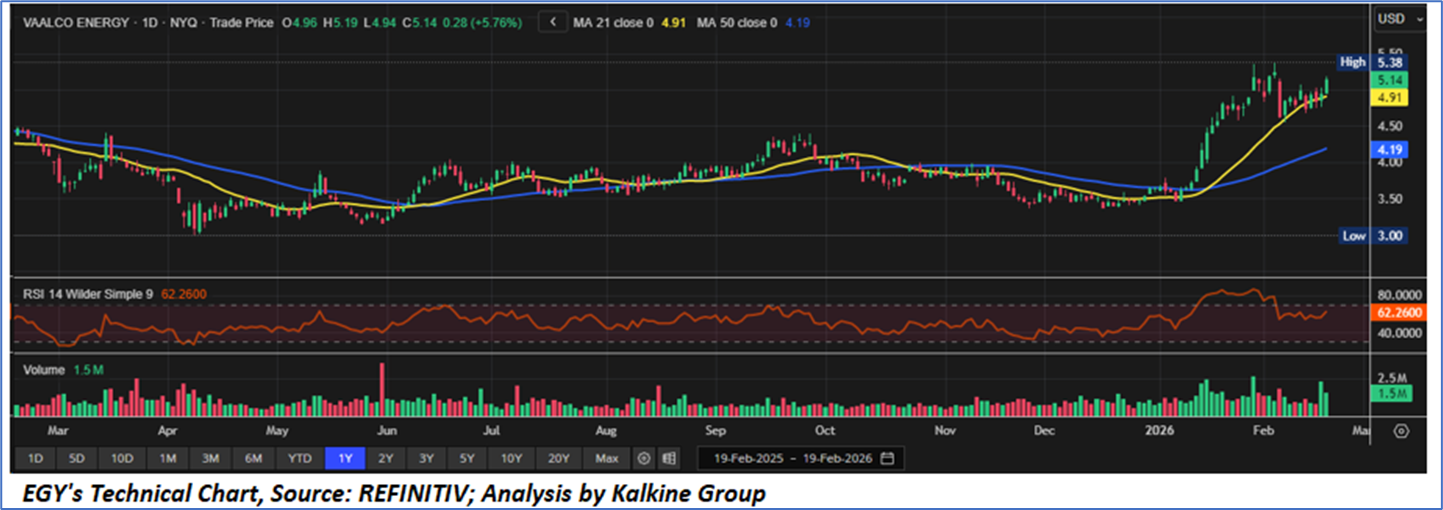
Trend Structure and Moving Average Alignment Reflect Confirmed Uptrend Bias: VAALCO Energy (NYSE: EGY) is trading near USD 5.14, firmly above its 21-day (USD 4.91) and 50-day (USD 4.19) moving averages, both of which are upward sloping. This alignment confirms a constructive intermediate-term uptrend following a breakout from prior consolidation. The 21-day moving average now acts as near-term dynamic support around USD 4.90.
Momentum Indicators Signal Constructive Strength: The RSI near 62 reflects strengthening bullish momentum without entering overbought territory. Higher RSI lows since late 2025 indicate improving internal strength, while supportive volume patterns during advances suggest orderly accumulation rather than speculative excess.
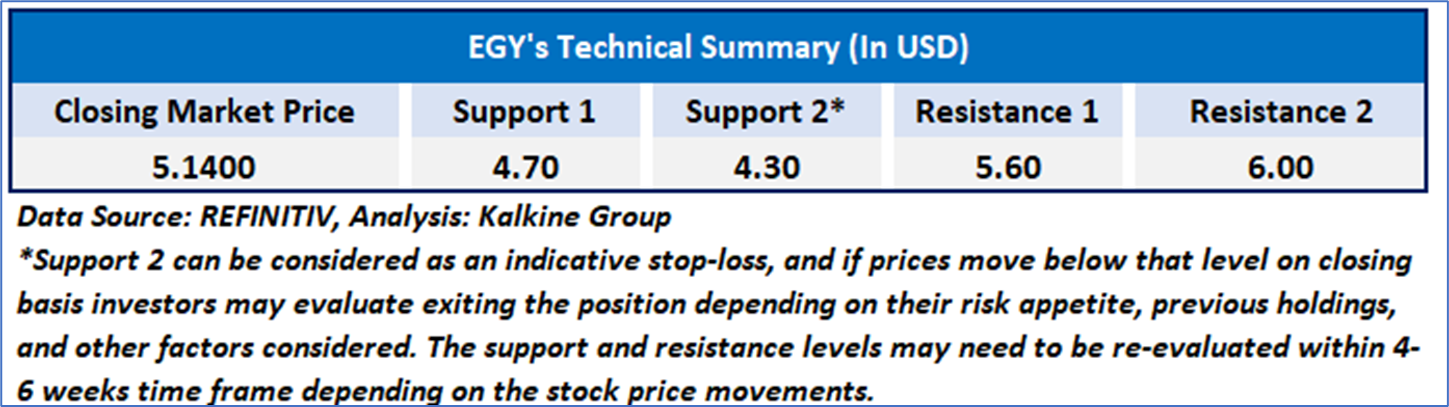
Key Support and Resistance Define Near-Term Direction: Immediate resistance is positioned near USD 5.35–5.40, the recent high. A sustained move above this level would reinforce trend continuation. Initial support lies near USD 4.90, with stronger structural support near USD 4.15–4.20. Overall, the technical structure remains positively biased unless key support levels fail.
VAALCO Energy delivered third-quarter 2025 production at the high end of guidance, reinforcing operational consistency despite a planned maintenance shutdown in Gabon and softer commodity pricing. While realized prices moderated and quarterly sales volumes declined sequentially, management raised full-year production and sales guidance midpoints, reflecting strong year-to-date field performance across Gabon and Egypt. Financially, the company remained profitable on a GAAP basis, controlled production expenses, and reduced full-year capital expenditure guidance by 19% from original levels, underscoring disciplined capital allocation. Liquidity was further supported through an expanded reserves-based credit facility and an active hedging program that locks in downside protection for both 2025 and 2026 production. Operational progress across Côte d’Ivoire, Egypt, and Gabon positions the company for incremental production growth into 2026, while the technical structure of the stock reflects a confirmed uptrend with constructive momentum.
As per the above-mentioned price action, important support near USD 4.60- USD 4.80, momentum in the stock over the last month, and technical indicators analysis, a “Buy” rating has been given for Vaalco Energy Inc (NYSE: EGY), at the closing price of USD5.14, as of February 19, 2026.
Individuals can evaluate the stock based on the support and resistance levels provided in the report in case of keen interest taking into consideration the risk-reward scenario.
Markets are trading in a highly volatile zone currently due to certain macro-economic issues and prevailing geopolitical tensions. Therefore, it is prudent to follow a cautious approach while investing.
Related Risk: This report may be looked at from a high-risk perspective, and a recommendation is provided for a short duration. This report is solely based on technical parameters, and the fundamental performance of the stocks has not been considered in the decision-making process. Other factors which could impact the stock prices include market risks, regulatory risks, interest rates risks, currency risks, social and political instability risks etc.
Note 1: Past performance is not a reliable indicator of future performance.
Note 2: The reference date for all price data, currency, technical indicators, support, and resistance level is February 19, 2026. The reference data in this report has been partly sourced from REFINITIV.
Note 3: Investment decisions should be made depending on an individual's appetite for upside potential, risks, holding duration, and any previous holdings. An 'Exit' from the stock can be considered if the Target Price mentioned as per the Valuation and or the technical levels provided has been achieved and is subject to the factors discussed above.
Note 4: Target Price refers to a price level that the stock is expected to reach as per the relative valuation method and or technical analysis taking into consideration both short-term and long-term scenarios.
Note 5: ‘Kalkine reports are prepared based on the stock prices captured either from the New York Stock Exchange (NYSE), NASDAQ Capital Markets (NASDAQ), and or REFINITIV. Typically, all sources (NYSE, NASDAQ, or REFINITIV) may reflect stock prices with a delay which could be a lag of 15-20 minutes. There can be no assurance that future results or events will be consistent with the information provided in the report. The information is subject to change without any prior notice.

 CA
 NZ
 UK
 US
 IND

 AU

 Please wait processing your request...