Pro Medicus Limited
.png)
PME Details
5-year Platform Deal with Nines: Pro Medicus Limited (ASX: PME) is engaged in the development and supply of software and IT solutions to the public and private health sectors. As on 3rd January 2020, the market capitalisation of the company stood at $2.32 billion. The company has recently announced that Visage Imaging, Inc., wholly-owned U.S. subsidiary of PME, has signed a 5-year, multi-million-dollar contract with Nines. This contract will open the potential for new Radiology-as-a-Service market for Visage. As per the release, 5-year contract is based on the committed exam volumes that step up year-on-year aligning with the projected growth of Nines offering in the market. This would be resulting in base revenue to Pro Medicus in excess of AUD$6 million over life of the contract with a potential for significant upside.Visage has also signed a 5-year contract, based on a transaction-based licensing model with The Ohio State University Wexler Medical Center. Thecontract would see Pro Medicus’ Visage 7 technology implemented throughout all of OSUWMC’s radiology departments, which spans 7 hospitals and outpatient clinics, as well as integrated to OSUWMC’s electronic health record.
Showcased Visage AI Accelerator Solution: The company announced that Visage Imaging, Inc., showcasedthe Visage AI Accelerator solution and the new Visage developed breast density classification algorithm at the Radiological Society of North America conference.
Healthy Increase in NPAT: Thecompany recorded another healthy increase in underlying Net Profit After Tax and stood at $19.13 million, up by 91.9% from $9.97 million in FY18. The Board increased fully franked dividend payments to 10.5 cents per share, up by 75% over the previous year representing a pay-out ratio of approximately 50%. The company remained cash flow positive with retained cash increasing from $25 million to $32 million after paying an increased dividend.
.png)
Financial Performance (Source: Company Reports)
Growth Opportunities: The company is planning new product offerings and expects transaction growth from existing clients. The company also anticipates additional upside with the adoption of new products and is expecting to extend to other geographical markets. PME expects that the future revenue will also be increased to $180 million over the next 5 years. The company also expects a strong pipeline in terms of quantity and quality of opportunities.
Improvement in Key Margins: During FY19, net margin of the company showed an improvement over the past year and stood at 38%, up from 29.4% in FY18. This indicates that the company is managing its costs well and is capable to convert its revenue in gross profit. In the same time period, Return on Equity stood at 45.3%, up from 28.5% in FY18. This implies that the company is well deploying the capital of its shareholders and is able to generate profits internally.
The stock ended the trade at $22.850, up 2.512% as on 03 January 2020.
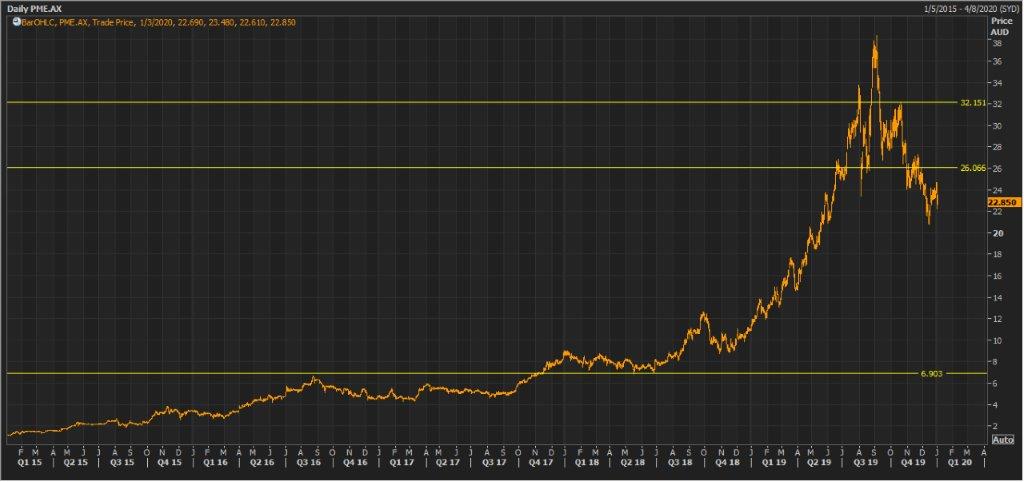
PME Daily Technical Chart (Source: Thomson Reuters)
Nanosonics Limited
.png)
NAN Details
Growth in Core Trophon Business: Nanosonics Limited (ASX: NAN) is focused on the research, development, and commercialisation of innovative technologies in infection control and decontamination. As on 3rd January 2020, the market capitalisation of the company stood at $1.91 billion. The company has recently appointed Dr Lisa McIntyre as a Non-executive Director with effect from 13th December 2019. In the recently held Annual General Meeting, the top management of the company addressed its shareholders and stated that the company has delivered excellent growth in core trophon business.
Substantial Rise in Profit Before Tax: For FY19, revenue of the company went up by 39% to $84.3 million from $60.7 million. In the same time period, profit before tax increased 201% on prior corresponding period and the figure stood at $16.8 million. The company ended the year with cash and cash equivalents of $72.2 million, while in FY18, the figure was $69.4 million. The cash and cash equivalents balance provide a robust balance sheet NAN to continue executing on the growth strategies.
.png)
Total Revenue (Source: Company Reports)
Strong Growth and Potential Expansion: The company expects FY20 operating expenses to around $67 million reflecting FY19 Q4 run rate plus accelerated investments in our growth strategy throughout new product development, business development, regional and corporate infrastructure expansion, new product launch readiness and sales and marketing. The company has also planned significant investments to support the strategic growth agenda and is planning to maintain a strong financial position to support growth.
The company is expecting to expand its global presence in Europe and Asia Pacific. It is also making significant investments in Research & Development and expects the investment to increase by 32% to $15 million in FY20.NAN will also commence commercial introduction of significant new products in FY21 and launch in a number of international markets throughout the first half of FY21.
Key Margins: During FY19, EBITDA margin showed an improvement over the past year and stood at 18.7% as compared to 7.1% in FY18. Net margin of the company was 16.1% in FY19, higher than the industry median of 12.1%. In the same period, current ratio of the company was 6.80x, higher than the industry median of 2.12x. This indicates that the company is liquid enough to pay off its liabilities using its current assets.
The stock ended the trade at $6.340, down 0.314% as on 03 January 2020.
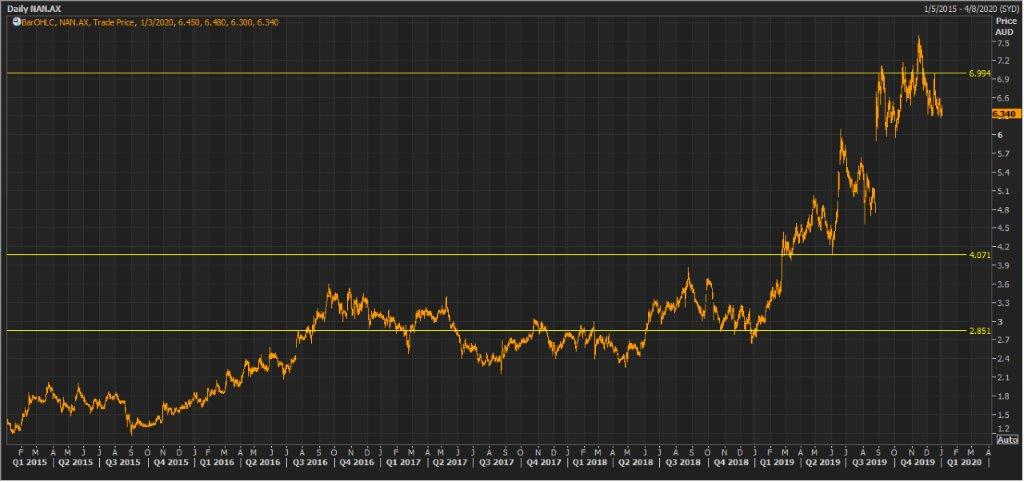
NAN Daily Technical Chart (Source: Thomson Reuters)
Disclaimer
The advice given by Kalkine Pty Ltd and provided on this website is general information only and it does not take into account your investment objectives, financial situation or needs. You should therefore consider whether the advice is appropriate to your investment objectives, financial situation and needs before acting upon it. You should seek advice from a financial adviser, stockbroker or other professional (including taxation and legal advice) as necessary before acting on any advice. Not all investments are appropriate for all people. Kalkine.com.au and associated pages are published by Kalkine Pty Ltd ABN 34 154 808 312 (Australian Financial Services License Number 425376). The information on this website has been prepared from a wide variety of sources, which Kalkine Pty Ltd, to the best of its knowledge and belief, considers accurate. You should make your own enquiries about any investments and we strongly suggest you seek advice before acting upon any recommendation. Kalkine Pty Ltd has made every effort to ensure the reliability of information contained in its newsletters and websites. All information represents our views at the date of publication and may change without notice. To the extent permitted by law, Kalkine Pty Ltd excludes all liability for any loss or damage arising from the use of this website and any information published (including any indirect or consequential loss, any data loss or data corruption). If the law prohibits this exclusion, Kalkine Pty Ltd hereby limits its liability, to the extent permitted by law to the resupply of services. There may be a product disclosure statement or other offer document for the securities and financial products we write about in Kalkine Reports. You should obtain a copy of the product disclosure statement or offer document before making any decision about whether to acquire the security or product. The link to our Terms & Conditions has been provided please go through them and also have a read of the Financial Services Guide. On the date of publishing this report (mentioned on the website), employees and/or associates of Kalkine Pty Ltd do not hold positions in any of the stocks covered on the website. These stocks can change any time and readers of the reports should not consider these stocks as advice or recommendations.
 AU
AU

 Please wait processing your request...