Oracle Corporation
Oracle Corporation (NYSE: ORCL) offers integrated suites of applications plus secure, autonomous infrastructure in the Oracle Cloud. The Company operates through three businesses: cloud and license, hardware and service. Its cloud and license business is engaged in the sale, marketing and delivery of its enterprise applications and infrastructure technologies through cloud and on-premise deployment models including its cloud services and license support offerings, and its cloud license and on-premise license offerings.

Key Business and Financial Updates:
- Strong Financial Performance and Growth Acceleration: Oracle Corporation delivered a robust Q3 FY2026 performance, with both organic total revenue and non-GAAP EPS growing at 20%+, marking the first such occurrence in over 15 years and significantly exceeding expectations. The company continues to demonstrate strong execution across segments, supported by its transition toward a recurring, cloud-driven revenue model, which enhances earnings visibility and scalability. Additionally, Oracle strengthened its strategic positioning through a 15% equity stake in TikTok’s U.S. data operations, contributing incremental non-operating income going forward.
- Cloud Applications Momentum and AI-Driven Innovation: Oracle’s Cloud Applications segment continues to exhibit strong momentum, with 11% revenue growth in constant currency and an annualized run rate of USD 16.1 billion. Key product suites such as Fusion ERP (+14%), SCM (+15%), HCM (+15%), and NetSuite (+11%) are driving growth, alongside 19% growth in industry-specific SaaS solutions. The company is aggressively embedding AI across its platform, having deployed over 1,000 AI agents and launched new CX applications, enabling enhanced automation and differentiation versus competitors. Furthermore, Oracle reported over 2,000 customer go-lives in the quarter, reflecting strong adoption and reduced implementation timelines.
- Multi-Cloud Database Expansion and Strategic Partnerships: Oracle’s multi-cloud database business is experiencing exceptional growth, with 531% year-over-year revenue expansion, supported by partnerships with major hyperscalers including Microsoft, Google, and Amazon. The company has achieved significant global scale, with 33 regions live on Microsoft Azure, 14 on Google Cloud, and rapid expansion on AWS (from 2 to 8 regions in Q3, targeting 22 by Q4). This strategy unlocks substantial latent demand, enabling customers to deploy Oracle databases across multiple cloud environments while leveraging advanced AI capabilities, thereby strengthening Oracle’s competitive positioning in enterprise cloud infrastructure.
- AI Infrastructure Growth and Capacity Scaling: Oracle’s AI infrastructure segment is witnessing rapid expansion, with 243% year-over-year growth and demand significantly exceeding supply, as reflected in a record Remaining Performance Obligation (RPO) of USD 553 billion. The company has secured over 10 GW of data center capacity over the next three years, with more than 90% of infrastructure funding supported by partners, minimizing balance sheet strain. Operational efficiency has improved materially, with rack output increasing 4x and deployment time reduced by 60%, while maintaining gross margins above 30% (32% in Q3), highlighting strong execution in scaling a capital-intensive business.
- Capital Strategy and Long-Term Outlook: Oracle has undertaken a proactive capital strategy, raising USD 30 billion through bonds and preferred stock as part of a broader USD 50 billion financing plan, positioning the company to fund large-scale AI and cloud infrastructure investments. The business continues to evolve toward a highly predictable, recurring revenue model, with increasing demand for AI, database, and cloud services driving upward revisions to FY2027 forecasts. With strong pipeline visibility, large contract wins (including USD 29 billion in new AI infrastructure deals), and a diversified, scalable platform, Oracle is well-positioned to sustain long-term growth and profitability.
Key Company specific risks for ORCL:
- Execution Risk in AI and Cloud Scaling: Oracle’s aggressive expansion in AI infrastructure and multi-cloud services requires significant capital deployment and operational execution; delays in capacity rollout, supply chain constraints, or underutilization of data centers could impact growth and margins.
- Intense Competitive Pressure: The company operates in highly competitive markets against hyperscalers such as Amazon, Microsoft, and Google, which may exert pricing pressure, limit market share gains, and require sustained investment in innovation.
- High Capital Intensity and Leverage Risk: Oracle’s planned USD 50 billion financing program and large-scale infrastructure investments increase exposure to leverage and interest costs, potentially impacting financial flexibility and returns if growth or demand expectations are not fully realized.
Technical Observation (on the daily chart):
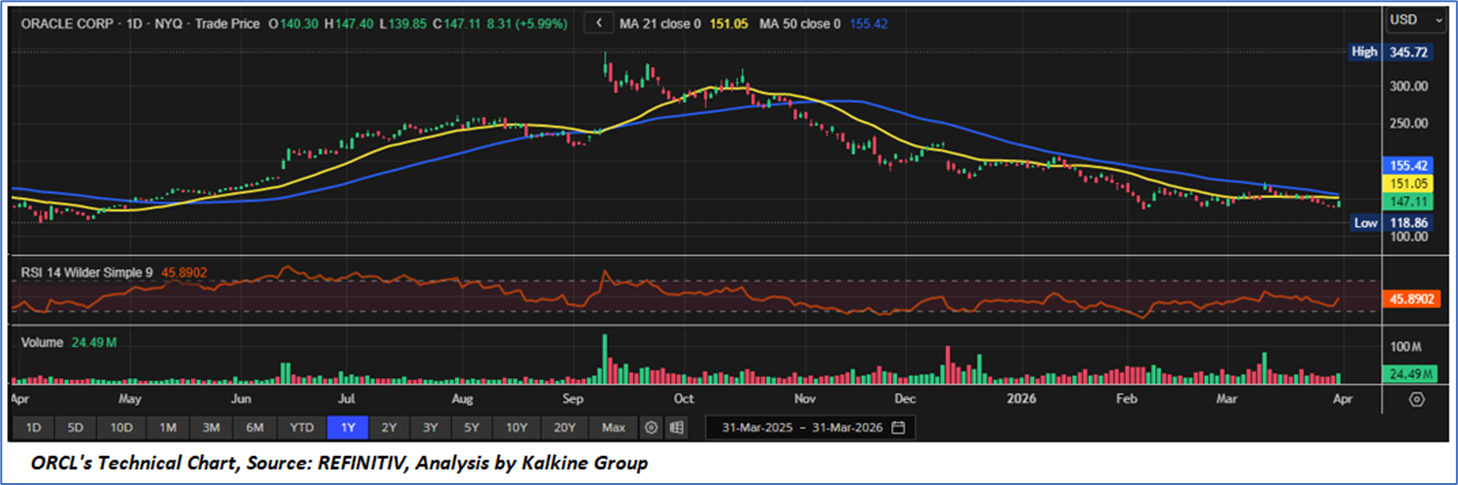
- Trend Structure and Moving Average Configuration: Oracle Corporation (ORCL) is currently exhibiting a prolonged corrective downtrend following its peak near USD 345.7, with price action consistently forming lower highs and lower lows. The stock is trading below both the 21-day moving average (~USD 151.1) and the 50-day moving average (~USD 155.4), reinforcing a bearish near-term technical bias. The downward slope of these moving averages, combined with persistent rejection near these levels, indicates sustained selling pressure and weak trend recovery attempts. The narrowing price range around USD ~145–150 suggests consolidation within a broader downtrend rather than a confirmed reversal.
- Momentum Indicators and Relative Strength Dynamics: The Relative Strength Index (RSI ~45.9) reflects a neutral-to-weak momentum profile, indicating that the stock is neither oversold nor demonstrating strong bullish momentum. The RSI’s inability to sustain above the 50 threshold highlights the absence of meaningful buying strength, while the lack of divergence suggests that downside risks have not fully dissipated. This positioning implies a continuation bias toward consolidation or gradual downside drift, unless a decisive momentum shift occurs supported by higher RSI readings.
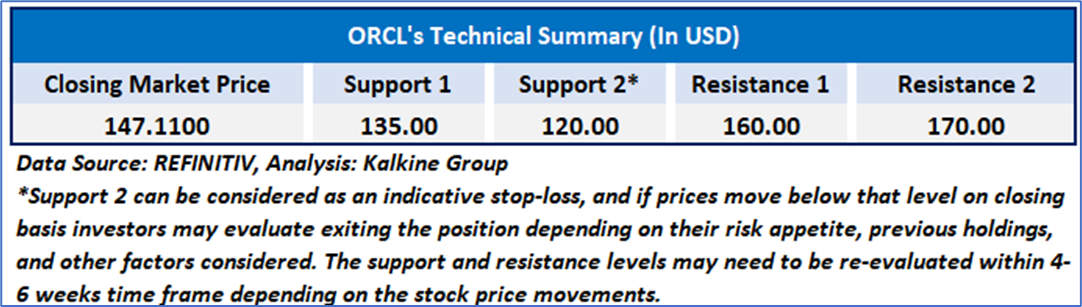
- Volume Patterns and Key Support-Resistance Framework: Volume trends indicate intermittent spikes during periods of price declines, suggesting distribution phases rather than accumulation. Immediate support is observed near the USD 140–145 range, with a stronger structural support level closer to USD 130, while resistance is concentrated between USD 151–155, aligning with key moving averages. A breakout above this resistance band would be necessary to signal a potential trend reversal, whereas failure to hold current support levels could expose further downside. Overall, the technical setup reflects a range-bound consolidation with a bearish undertone, requiring confirmation through volume-supported breakouts for directional clarity.
Oracle Corporation demonstrates strong operational momentum driven by its transition to a recurring, cloud-centric business model, supported by 20%+ growth in both revenue and non-GAAP EPS, robust expansion in cloud applications (USD 16.1 billion run rate, +11% growth), and exceptional scaling in high-growth segments such as multi-cloud database (+531% YoY) and AI infrastructure (+243% YoY). The company’s strategic investments in AI capabilities, global cloud partnerships, and infrastructure capacity (including USD 553 billion RPO and over 10 GW secured capacity) position it well for sustained long-term growth, further reinforced by a USD 30 billion capital raise under a broader USD 50 billion plan. However, this outlook is balanced by execution risks related to large-scale infrastructure deployment, competitive pressures from hyperscalers, and elevated capital intensity, while current technical indicators reflect a near-term consolidation phase within a broader corrective trend
As per the above-mentioned price action, important support near USD130-USD140, momentum in the stock over the last month, and technical indicators analysis, a ‘WATCH’ rating has been given for Oracle Corporation (NYSE: ORCL), at the closing price of USD 147.11, as of March 31, 2026.
Individuals can evaluate the stock based on the support and resistance levels provided in the report in case of keen interest taking into consideration the risk-reward scenario.
Markets are trading in a highly volatile zone currently due to certain macro-economic issues and prevailing geopolitical tensions. Therefore, it is prudent to follow a cautious approach while investing.
Related Risk: This report may be looked at from a high-risk perspective, and a recommendation is provided for a short duration. This report is solely based on technical parameters, and the fundamental performance of the stocks has not been considered in the decision-making process. Other factors which could impact the stock prices include market risks, regulatory risks, interest rates risks, currency risks, social and political instability risks etc.
Note 1: Past performance is not a reliable indicator of future performance.
Note 2: The reference date for all price data, currency, technical indicators, support, and resistance level is March 31, 2026. The reference data in this report has been partly sourced from REFINITIV.
Note 3: Investment decisions should be made depending on an individual's appetite for upside potential, risks, holding duration, and any previous holdings. An 'Exit' from the stock can be considered if the Target Price mentioned as per the Valuation and or the technical levels provided has been achieved and is subject to the factors discussed above.
Note 4: Target Price refers to a price level that the stock is expected to reach as per the relative valuation method and or technical analysis taking into consideration both short-term and long-term scenarios.
Note 5: ‘Kalkine reports are prepared based on the stock prices captured either from the New York Stock Exchange (NYSE), NASDAQ Capital Markets (NASDAQ), and or REFINITIV. Typically, all sources (NYSE, NASDAQ, or REFINITIV) may reflect stock prices with a delay which could be a lag of 15-20 minutes. There can be no assurance that future results or events will be consistent with the information provided in the report. The information is subject to change without any prior notice.

 CA
 NZ
 UK
 US
 IND

 AU

 Please wait processing your request...