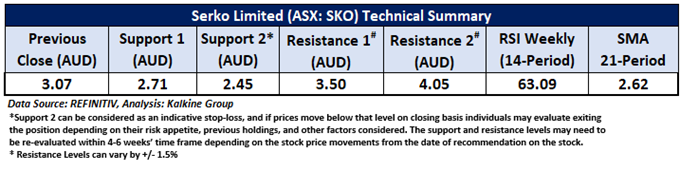
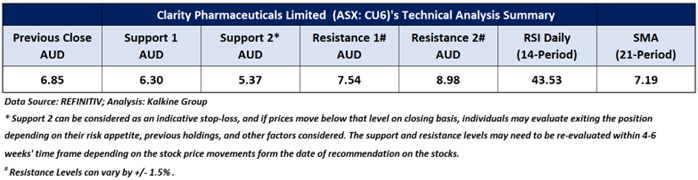
Company Overview: Serko Limited (ASX: SKO) provides online travel booking software solutions and expense management services in New Zealand, Australia, North America, Europe, and internationally. Clarity Pharmaceuticals Limited (ASX: CU6) engages in research and development and clinical stage radiopharmaceuticals products in Australia and the United States. This Report covers the Price Action, Technical Indicators Analysis along with the Support Levels, Resistance Levels, and Recommendations on these stocks.
Recent Update: Serko Limited recently unveiled its plans to broaden its presence in North America, including a strategic long-term partnership with the global travel software provider Sabre Corporation (NASDAQ: SABR). As part of this collaboration, Serko will acquire Sabre's business travel management solution, GetThere, positioning itself as the second-largest online booking tool provider in North America.
Financial Results for 1HFY25: In the unaudited financial results for the first half of FY25 (for the period ending 30 September 2024), the company reported total income of NZD 42.7mn, reflecting an 18% increase compared to the previous period. Total spending was NZD 44.3mn, up 5% YoY. Operating expenses reached NZD 50.6mn, marking a 12% increase on a year-over-year basis. Additionally, free cash flow was reported at NZD 1.3mn, with increases of NZD 4.7mnas compared to same period last year. Total income growth accelerated in the second quarter, fueled by a rise in customer acquisition and increased activity in unmanaged travel.
SKO’s Technical Analysis:
On the daily chart, SKO’s stock price has broken out from a descending wedge pattern with a breakaway gap, indicating a positive trend. Additionally, following a bottom divergence relative to prices, the 14-period RSI is moving upward from its midpoint, further supporting this outlook. The stock is trading above both the 21-period and 50-day SMAs, which may potentially function as dynamic support levels for the stock; in contrast, the stock’s most recent high might act as a resistance level. Critical support for the stock is positioned at AUD 2.71, while key resistance is placed at AUD 3.50.

Daily Technical Chart – SKO
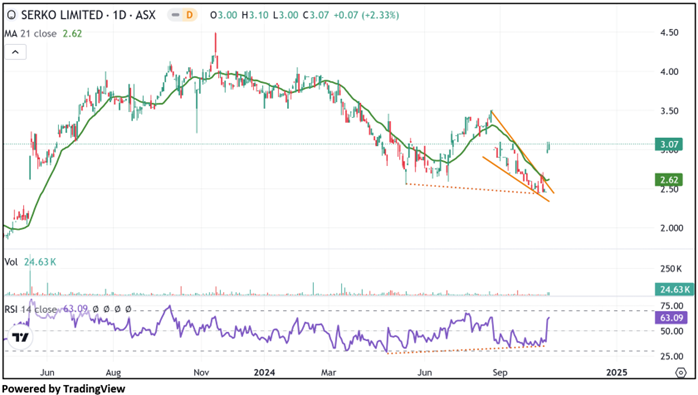
Considering the stock’s current price levels forming higher peaks and higher troughs, and momentum oscillator analysis, a “Speculative Buy” recommendation is given on the stock. The stock was analysed as per the closing price of AUD 3.07 per share as on 30 October 2024, up by 2.33%. Serko Limited (ASX: SKO) was last covered in a report dated ’29 November 2019’.
CU6’s Technical Analysis:
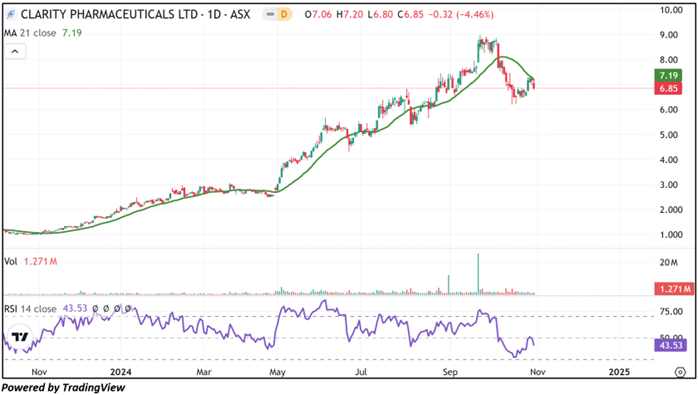
On the daily chart, CU6's stock price is experiencing a minor correction during an uptrend, indicating suggesting a short-term neutral trend. Additionally, the RSI (14-period) is trading near its midpoint, providing further support for the mentioned recommendation. Prices are trading below both the 21-period and 50-day SMAs, which may potentially function as dynamic resistance levels for the stock; in contrast, the stock’s most recent low might act as a support level. Important support for the stock is located at AUD 6.30, while significant resistance is situated at AUD 7.54.
Daily Technical Chart – CU6
Individuals can evaluate the stock based on the support and resistance levels provided in the report in case of keen interest, taking into consideration the risk-reward scenario.
Considering the stock’s current price levels undergoing a correction during an uptrend, and momentum oscillator analysis, a “Watch” recommendation is given on the stock. The stock was analysed as per the closing price of AUD 6.85 per share as on 30 October 2024, down by 4.46%. Clarity Pharmaceuticals Limited (ASX: CU6) was last covered in a report dated ’06 June 2024’.
Note 1: Past performance is neither an Indicator nor a guarantee of future performance.
Note 2: Investment decision should be made depending on an individual’s appetite for upside potential, risks, and any previous holdings. This recommendation is purely based on technical analysis, and fundamental analysis has not been considered in this report.
Note 3: Related Risks: This report may be looked at from high-risk perspective and recommendations are provided are for a short duration. Recommendations provided in this report are solely based on technical parameters, and the fundamental performance of the stocks has not been considered in the decision-making process. Other factors which could impact the stock prices include market risks, regulatory risks, interest rates risks, currency risks, social and political instability risks etc.
The reference date for all price data, currency, technical indicators, support, and resistance levels is October 30, 2024. The reference data in this report has been partly sourced from REFINITIV.
Technical Indicators Defined:
Support: A level at which the stock prices tend to find support if they are falling, and a downtrend may take a pause backed by demand or buying interest. Support 1 refers to the nearby support level for the stock and if the price breaches the level, then Support 2 may act as the crucial support level for the stock.
Resistance: A level at which the stock prices tend to find resistance when they are rising, and an uptrend may take a pause due to profit booking or selling interest. Resistance 1 refers to the nearby resistance level for the stock and if the price surpasses the level, then Resistance 2 may act as the crucial resistance level for the stock.
Stop-loss: It is a level to protect further losses in case of unfavourable movement in the stock prices.
The Green colour line reflects the 21-period moving average. SMA helps to identify existing price trends. If the prices are trading above the 21-period, prices are currently in a bullish trend (Vice – Versa).
The Blue colour line reflects the 50-period moving average. SMA helps to identify existing price trends. If the prices are trading above the 50-period, prices are currently in a bullish trend (Vice – Versa).
The Orange/ Yellow colour line represents the Trendline.
The Purple colour line in the chart’s lower segment reflects the Relative Strength Index (14-Period), which indicates price momentum and signals momentum in trend. A reading of 70 or above suggests overbought status, while a reading of 30 or below suggests an oversold status.
 AU
AU

 Please wait processing your request...