Company Overview: Mesoblast Limited (ASX: MSB) engages in the development of regenerative medicine products in Australia, the United States, Singapore, and Switzerland, offering products in the areas of cardiovascular, spine orthopaedic disorder, oncology, haematology, and immune-mediated and inflammatory diseases. Archer Materials Limited (ASX: AXE) engages in development and commercialization of semiconductor devices, and processor chips related to quantum computing and medical diagnostics in Australia, primarily focusing on the development of qubit processor chip, that operates at room temperature and integrate into modern electronics; and graphene-based lab-on-a-chip biochip technology. This Report covers the Price Action, Technical Indicators Analysis along with the Support Levels, Resistance Levels, and Recommendations on these stocks.
Recent Updates:
MSB reported USD 3.4mn in revenue from royalties, predominantly on sales of TEMCELL® HS Inj.1 sold in Japan by its licensee in 1HFY24 ended 31 December 2023. Loss after tax reduced from USD 41.4mn in 1HFY23 to USD 32.5mn in 1HFY24. For the six months ended December 31, 2023, net cash usage stood at US 26.6mn, a 14% reduction compared to FY23.
MSB is committed to progressing its Phase 3 programs in adults with steroid-refractory acute graft versus host disease (SR-aGVHD) and chronic low back pain (CLBP). The company is studying its lead product Ryoncil® (remestemcel-L) in children with acute GVHD, rexlemestrocel-L in back pain, and cardiovascular product Revascor® in children with life-threatening congenital heart disease.
MSB recently stated that U.S. FDA supports the approval pathway for rexlemestrocel-L, Mesoblast’s allogeneic mesenchymal precursor cell (MPC) product, in patients with end-stage ischemic heart failure with concentrated ejection fraction (HFrEF) and a left ventricular assist device (LVAD). Focus is on tapping global scale partnerships and advancing cost reduction strategies.
MSB’s Technical Analysis:
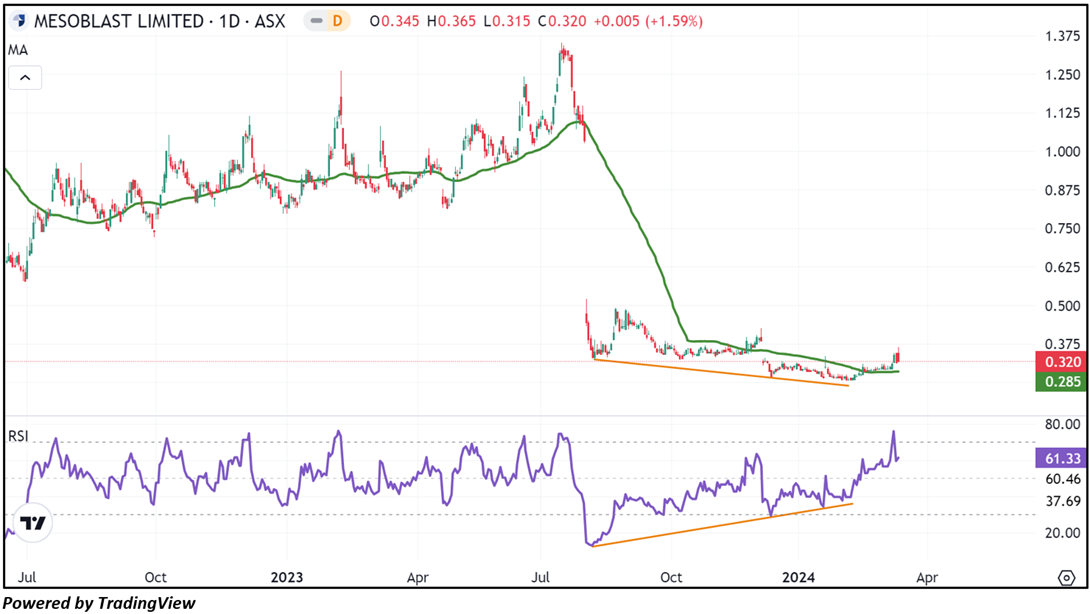
On the daily chart, MSB's stock price broke above the trend-following indicator 50-day SMA in the middle of February, indicating a positive bias. Additionally, after forming multiple divergences in relation to prices, the RSI (14-period) is heading north from the midpoint, providing further support for the mentioned recommendation. Prices are trading above the 50-day SMA, which may potentially function as a dynamic support level for the stock; in contrast, the stock’s most recent high might act as a resistance level. Critical support for the stock is positioned at AUD 0.285, while significant resistance is placed at AUD 0.365.


Daily Technical Chart – MSB

Considering the stock’s current price levels forming higher peaks and higher troughs, and momentum oscillator analysis, a “Speculative Buy” recommendation is given on the stock. The stock was analysed as per the closing price of AUD 0.320 per share as on 11 March 2024, up by 1.59%. Mesoblast Limited (ASX: MSB) was last covered in a report dated ’29 February 2024’.
Recent Updates:
Archer Materials is a semiconductor entity that has advanced its Biochip gFET chip design (announced on 11 March 2024) by reducing the size significantly. The miniaturized chip design has been sent to a foundry partner, Applied Nanolayers, for fabrication. The chip is expected to undergo wafer dicing, assembly, packaging, and related electrical testing. Subsequently, the delivery of the new miniature packaged chips is anticipated in mid-2024.
Financially, the Company generates no revenue as of now. However, net loss was reduced by 21% YoY in H1 FY24. Operationally, AXE progressed its qubit readout technology development for the 12CQ quantum chip operation and function during Q2 FY24. The Company ended Q2 FY24 (ended 31 December 2023) with no debt and cash position of AU$21.5 million to fund activities.
AXE’s Technical Analysis:
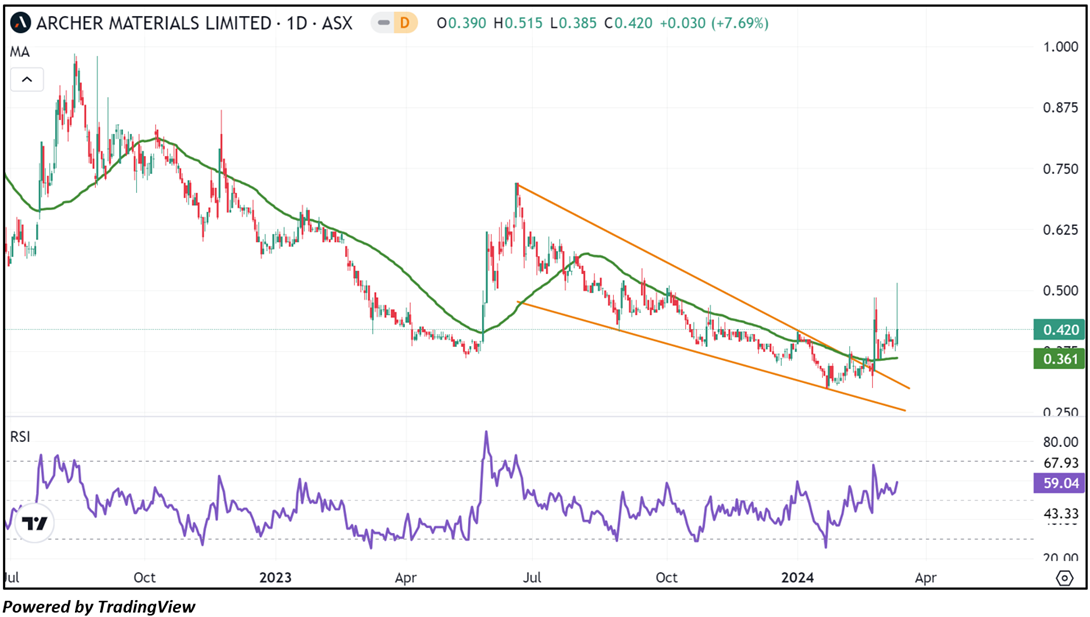
On 23 February 2024, AXE's stock price broke above a descending wedge pattern on the daily chart, signalling a positive trend. Since then, the stock has been creating higher peaks and higher troughs, indicating that the short-term uptrend remains intact. Additionally, the RSI (14-period) is heading upward from the midpoint, providing further support for the mentioned recommendation. Prices are trading above the 50-day SMA, which may potentially function as a dynamic support level for the stock; in contrast, the stock’s most recent high might act as a resistance level. Important support for the stock is located at AUD 0.375, while key resistance is situated at AUD 0.485.


Daily Technical Chart – AXE

Considering the stock’s current price levels breaking above a descending wedge pattern, and momentum oscillator analysis, a “Speculative Buy” recommendation is given on the stock. The stock was analysed as per the closing price of AUD 0.420 per share as on 11 March 2024, up by 7.69%. Archer Materials Limited (ASX: AXE) was last covered in a report dated ’07 July 2022’.
Markets are trading in a highly volatile zone currently due to certain macro-economic issues and geopolitical tensions prevailing. Therefore, it is prudent to follow a cautious approach while investing.
Note 1: Past performance is neither an Indicator nor a guarantee of future performance.
Note 2: Investment decision should be made depending on an individual’s appetite for upside potential, risks, and any previous holdings. This recommendation is purely based on technical analysis, and fundamental analysis has not been considered in this report.
Note 3: Related Risks: This report may be looked at from high-risk perspective and recommendations are provided are for a short duration. Recommendations provided in this report are solely based on technical parameters, and the fundamental performance of the stocks has not been considered in the decision-making process. Other factors which could impact the stock prices include market risks, regulatory risks, interest rates risks, currency risks, social and political instability risks etc.
The reference date for all price data, currency, technical indicators, support, and resistance levels is March 11, 2024. The reference data in this report has been partly sourced from REFINITIV.
Technical Indicators Defined:
Support: A level at which the stock prices tend to find support if they are falling, and a downtrend may take a pause backed by demand or buying interest. Support 1 refers to the nearby support level for the stock and if the price breaches the level, then Support 2 may act as the crucial support level for the stock.
Resistance: A level at which the stock prices tend to find resistance when they are rising, and an uptrend may take a pause due to profit booking or selling interest. Resistance 1 refers to the nearby resistance level for the stock and if the price surpasses the level, then Resistance 2 may act as the crucial resistance level for the stock.
Stop-loss: It is a level to protect further losses in case of unfavourable movement in the stock prices.
The Green colour line reflects the 21-period moving average. SMA helps to identify existing price trends. If the prices are trading above the 21-period, prices are currently in a bullish trend (Vice – Versa).
The Blue colour line reflects the 50-period moving average. SMA helps to identify existing price trends. If the prices are trading above the 50-period, prices are currently in a bullish trend (Vice – Versa).
The Orange/ Yellow colour line represents the Trendline.
The Purple colour line in the chart’s lower segment reflects the Relative Strength Index (14-Period), which indicates price momentum and signals momentum in trend. A reading of 70 or above suggests overbought status, while a reading of 30 or below suggests an oversold status.
AU


 Please wait processing your request...