Company Overview: Pointerra Limited (ASX: 3DP) provides a cloud-based solution for storing, processing, managing, analyzing, extracting, visualizing, and sharing 3D data. Infini Resources Limited (ASX: I88) is a mineral and exploration company committed to increasing shareholder wealth through the acquisition, exploration and development of lithium and uranium mineral resource projects throughout Australia and Canada. This Report covers the Price Action, Technical Indicators Analysis along with the Support Levels, Resistance Levels, and Recommendations on these stocks.
Recent Updates:
Financial Highlight: During H1 FY24, it reported a decline in revenue (AU$1.37 million, down 36%) and cash receipts (AU$1.87 million, down 36%) from customers for the half-year compared to the previous period.
On 30 May 2024, Pointerra Limited announced that it received oversubscribed placement and subsequently, raised AU$2.05 million at an issue price of $0.033 per share. The Company plans to leverage these funds to pursue strategic initiatives, including recruitment of enterprise sales professionals to deliver on existing opportunities and shorten the sales cycle. On 28 June 2024, Pointerra announced that it received US$1.63 million contract from the US Department of Energy (DOE) for an R&D program (Program).
Outlook: 3DP is set to capitalize on qualified 7 & 8 figure USD ARR enterprise sales opportunities from a rapidly expanding sales pipeline across all sectors. Moreover, new channel partners shall expand reach and scale without adding to the direct sales cost base. However, similar to many small-cap stocks, 3DP may experience higher volatility compared to larger, more established companies. This volatility can lead to rapid fluctuations in its stock price.
3DP’s Technical Analysis:
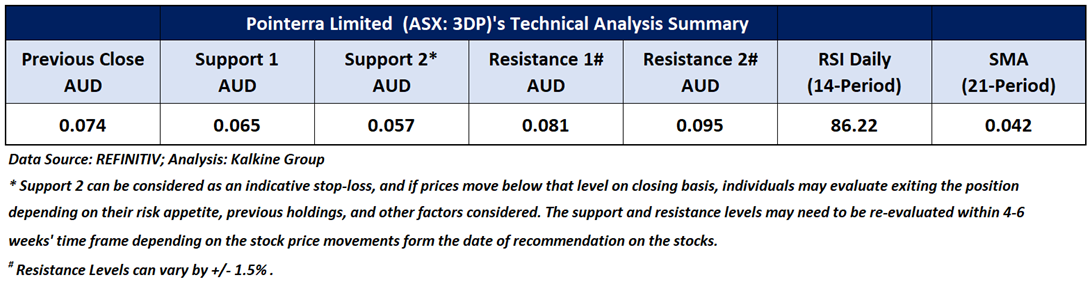
On the daily chart, 3DP's stock price broke above a descending wedge pattern, signalling a positive trend. Additionally, the RSI (14-period) is heading north from the midpoint, providing further support for the mentioned recommendation. Prices are trading above both the 21-period and 50-day SMAs, which may potentially function as dynamic support levels for the stock; in contrast, the stock’s previous peak might act as a resistance level. Crucial support for the stock is positioned at AUD 0.065, while key resistance is placed at AUD 0.081.

Daily Technical Chart – 3DP
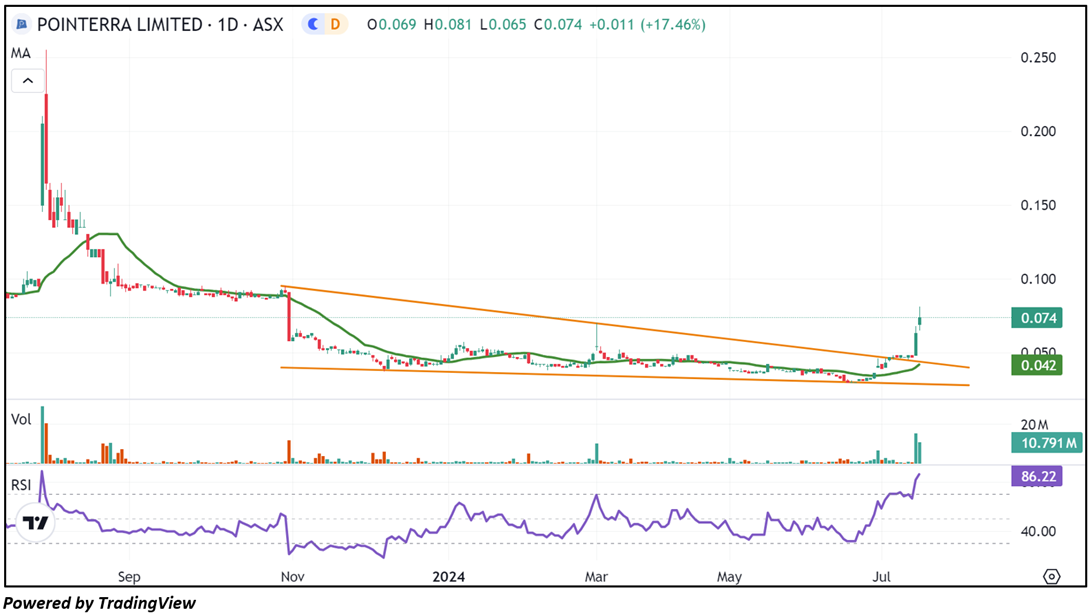
Considering the stock’s current price levels breaking above a descending wedge pattern, and momentum oscillator analysis, a “Speculative Buy” recommendation is given on the stock. The stock was analysed as per the closing price of AUD 0.074 per share as on 15 July 2024, up by 17.46%. Pointerra Limited (ASX: 3DP) was last covered in a report dated ’20 December 2021’.
I88’s Technical Analysis:
At the beginning of July 2024, I88's stock price broke above a descending triangle pattern, signalling a positive trend. Since then, the stock has been creating higher peaks and higher troughs, indicating that the short-term uptrend remains intact. Moreover, the RSI (14-period) is heading north from the midpoint, adding more evidence to the previous observation. Prices are trading above both the 21-period and 50-day SMAs, which may potentially function as dynamic support levels for the stock; in contrast, the stock’s next round level might serve as a resistance level. Critical support for the stock is positioned at AUD 0.750, while significant resistance is placed at AUD 1.000.


Daily Technical Chart – I88
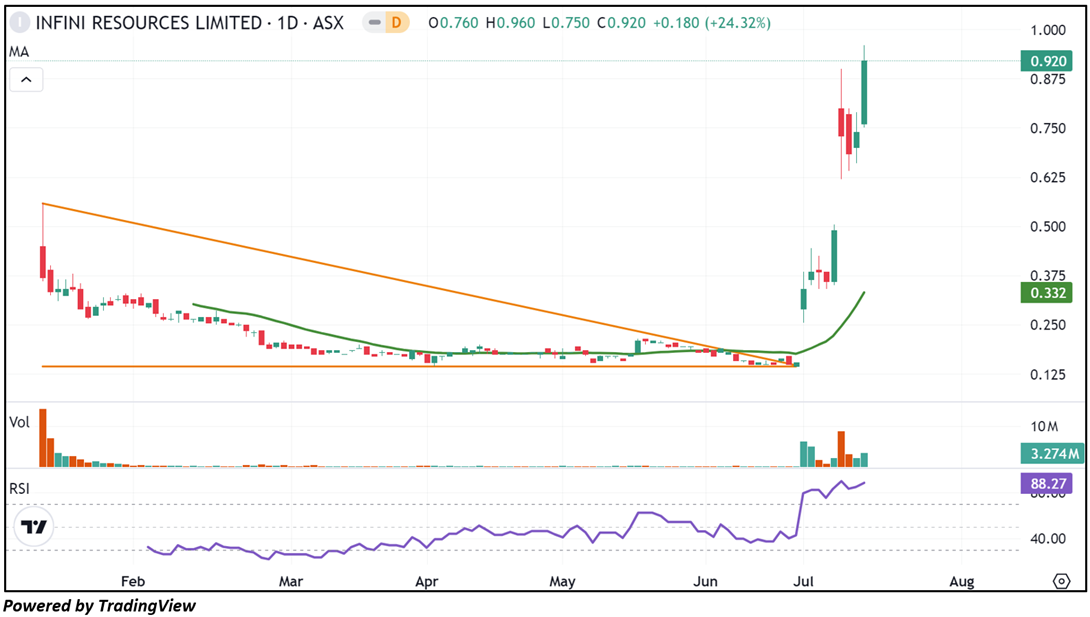
Considering the stock’s current price levels forming higher peaks and higher troughs, and momentum oscillator analysis, a “Speculative Buy” recommendation is given on the stock. The stock was analysed as per the closing price of AUD 0.920 per share as on 15 July 2024, up by 24.32%.
Note 1: Past performance is neither an Indicator nor a guarantee of future performance.
Note 2: Investment decision should be made depending on an individual’s appetite for upside potential, risks, and any previous holdings. This recommendation is purely based on technical analysis, and fundamental analysis has not been considered in this report.
Note 3: Related Risks: This report may be looked at from high-risk perspective and recommendations are provided are for a short duration. Recommendations provided in this report are solely based on technical parameters, and the fundamental performance of the stocks has not been considered in the decision-making process. Other factors which could impact the stock prices include market risks, regulatory risks, interest rates risks, currency risks, social and political instability risks etc.
The reference date for all price data, currency, technical indicators, support, and resistance levels is July 15, 2024. The reference data in this report has been partly sourced from REFINITIV.
Technical Indicators Defined:
Support: A level at which the stock prices tend to find support if they are falling, and a downtrend may take a pause backed by demand or buying interest. Support 1 refers to the nearby support level for the stock and if the price breaches the level, then Support 2 may act as the crucial support level for the stock.
Resistance: A level at which the stock prices tend to find resistance when they are rising, and an uptrend may take a pause due to profit booking or selling interest. Resistance 1 refers to the nearby resistance level for the stock and if the price surpasses the level, then Resistance 2 may act as the crucial resistance level for the stock.
Stop-loss: It is a level to protect further losses in case of unfavourable movement in the stock prices.
The Green colour line reflects the 21-period moving average. SMA helps to identify existing price trends. If the prices are trading above the 21-period, prices are currently in a bullish trend (Vice – Versa).
The Blue colour line reflects the 50-period moving average. SMA helps to identify existing price trends. If the prices are trading above the 50-period, prices are currently in a bullish trend (Vice – Versa).
The Orange/ Yellow colour line represents the Trendline.
The Purple colour line in the chart’s lower segment reflects the Relative Strength Index (14-Period), which indicates price momentum and signals momentum in trend. A reading of 70 or above suggests overbought status, while a reading of 30 or below suggests an oversold status.
 AU
AU

 Please wait processing your request...