Company Overview: Peninsula Energy Limited (ASX: PEN) is an Australia-based uranium mining company. The company operates in 3 segments: Lance Projects, Karoo Projects, and South Africa. DevEx Resources Limited (ASX: DEV) engages in the exploration and evaluation of mineral properties, including uranium, copper, nickel, gold, rare earth element, and platinum group elements in Australia. This Report covers the Price Action, Technical Indicators Analysis along with the Support Levels, Resistance Levels, and Recommendations on these stocks.
Recent Updates:
Peninsula Energy Limited is an ASX listed Uranium entity that posted USD 40.40 million of revenue in FY23, compared to USD 18.30 million in FY22. However, due to the higher cost of sales, the Company witnessed a hit on its gross profit. Notwithstanding, loss for the year ended 30 June 2023, reduced to USD 3.54 million from USD 4.62 million in FY22.
In November 2023, the Company also raised AUD 60 million to finance restart of Uranium production at Lance Project. Lance is the near-term largest uranium producer project in the US.
Other growth catalysts for the Company include further drilling at Kendrick and Barber areas, the newly established Dagger project, imbalance between supply and demand to meet global decarbonization targets.
On 10 January 2024, the Company also unveiled that it has received AUD 50 million institutional placement by issuing 666.7 million ordinary shares at AUD 0.075 per share.
PEN’s Technical Analysis:
On the daily chart, PEN prices are trading above the falling trendline breakout level. Moreover, the momentum oscillator RSI (14-period) is showing a reading of ~52.74 level. Further, the prices are trading above the trend-following indicator 21-period SMA, which may act as a support level. An important support level for the stock is placed at AUD 0.093, while the key resistance level is placed at AUD 0.118.
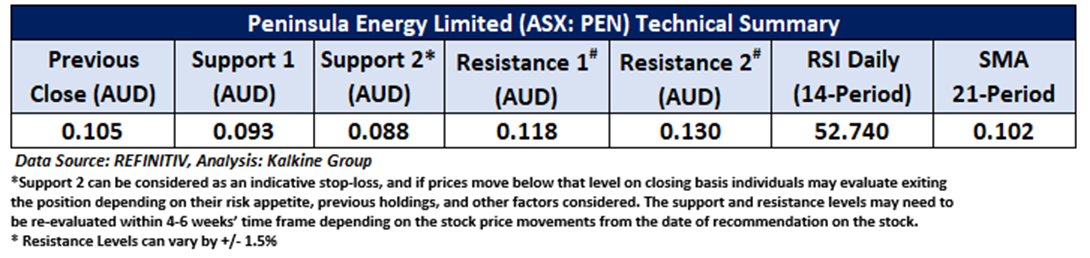

Daily Technical Chart – PEN
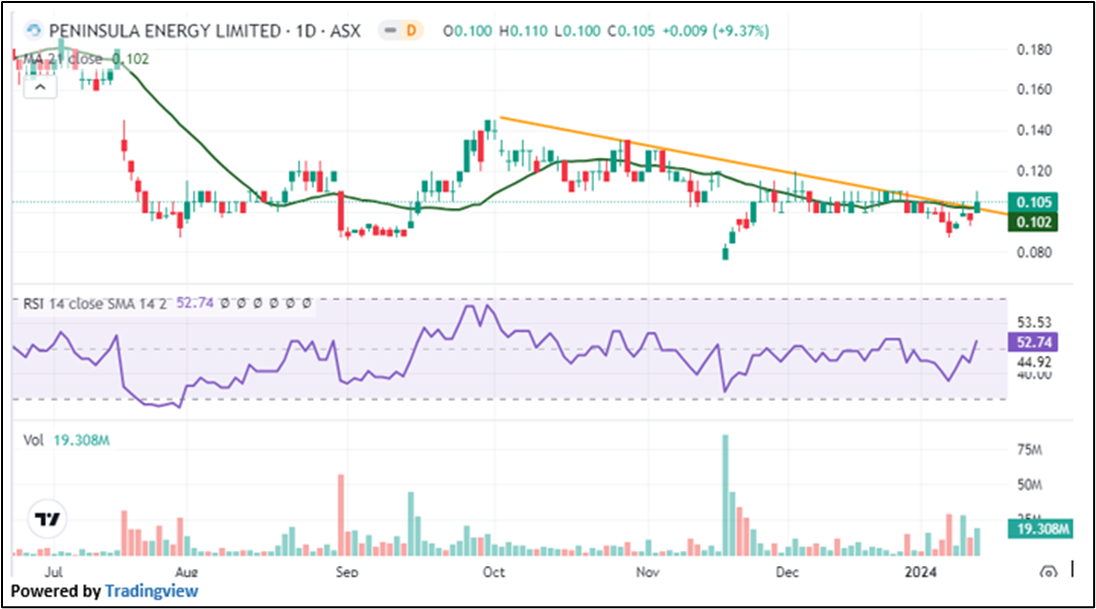
Considering the stock’s current price levels are trading above the falling trendline breakout level, and momentum oscillator analysis, a “Speculative Buy” recommendation is given on the stock. The stock was analysed as per the closing price of AUD 0.105 per share as on 12 January 2024, up by 9.37%. Peninsula Energy Limited (ASX: PEN) was last covered in a report dated ’21 November 2023’.
Recent Updates:
On 13 October 2023, DEV secured ASD 10 million via Placement at an issue price of AUD 0.30 per share. The purpose of this placement is to support several early-stage projects, including acquisition of Murphy West Uranium project and the Highway Nickel project.
On 6 December 2023, DEV found high-quality uranium during the recent drilling at their Nabarlek Uranium Project in Australia. This project is in a good spot for uranium, known as the Alligator Rivers Uranium Province. The drilling focused on two critical areas, U40 and Nabarlek Faults, which include the old Nabarlek Uranium Mine. This mine used to be the highest-grade uranium mine in Australia, producing a lot in the past—this year's exploration aimed at finding more high-quality uranium in these areas.
DEV’s total cash and cash equivalent recorded AUD 12.68 million in FY23 compared to AUD 7.88 million in FY22 driven by issuance of shares during the year. The company’s net loss reached negative AUD 12.93 million in FY23 vs negative AUD 11.91 million in FY22. Due to the costs of exploring and evaluating new projects based on their financial rules.
DEV’s Technical Analysis:
On the daily chart, DEV's is rebounding from the lower boundary of a symmetrical triangle pattern, indicating that the stock might continue to head higher to the pattern’s upper edge. Additionally, the RSI (14-period) is heading north from the midpoint, adding further support to the previous analysis. Prices are fluctuating between its previous peak and trough, which may potentially function as resistance and support levels for the stock, respectively. Important support for the stock is positioned at AUD 0.270, while key resistance is placed at AUD 0.335.
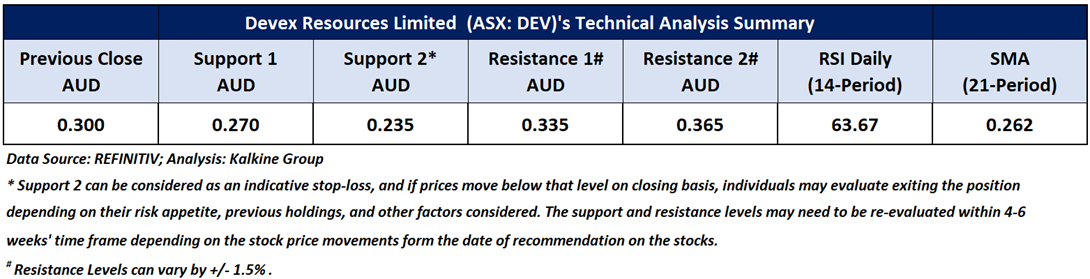

Daily Technical Chart – DEV
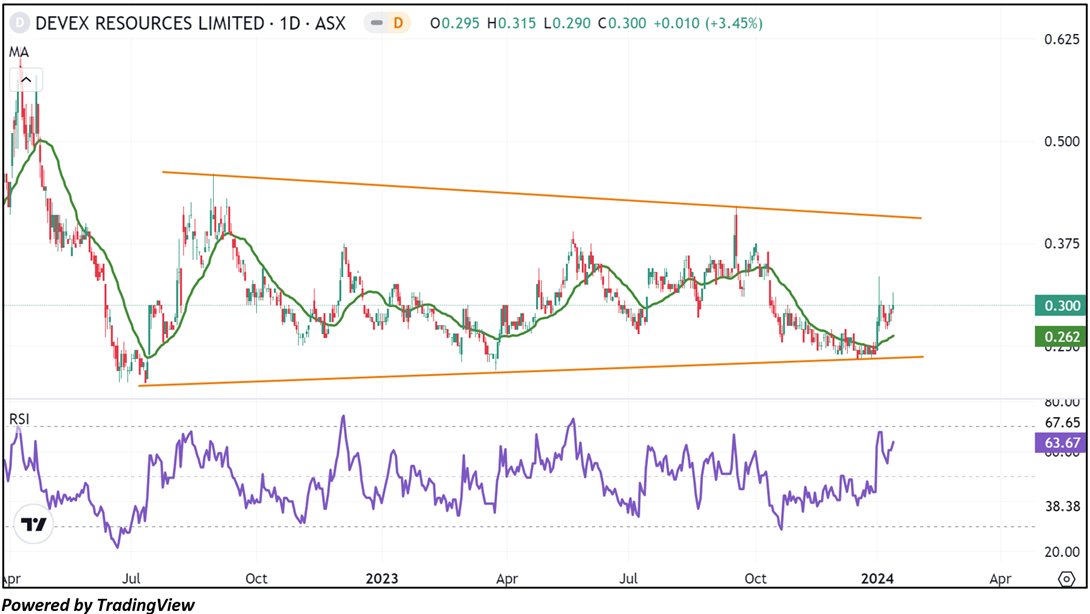
Considering the stock’s current price levels forming a symmetrical triangle pattern, and momentum oscillator analysis, a “Speculative Buy” recommendation is given on the stock. The stock was analysed as per the closing price of AUD 0.300 per share as on 12 January 2024, up by 3.45%. DevEx Resources Limited (ASX: DEV) was last covered in a report dated ’18 May 2023’.
Markets are trading in a highly volatile zone currently due to certain macro-economic issues and geopolitical tensions prevailing. Therefore, it is prudent to follow a cautious approach while investing.
Note 1: Past performance is neither an Indicator nor a guarantee of future performance.
Note 2: Investment decision should be made depending on an individual’s appetite for upside potential, risks, and any previous holdings. This recommendation is purely based on technical analysis, and fundamental analysis has not been considered in this report.
Note 3: Related Risks: This report may be looked at from high-risk perspective and recommendations are provided are for a short duration. Recommendations provided in this report are solely based on technical parameters, and the fundamental performance of the stocks has not been considered in the decision-making process. Other factors which could impact the stock prices include market risks, regulatory risks, interest rates risks, currency risks, social and political instability risks etc.
The reference date for all price data, currency, technical indicators, support, and resistance levels is January 12, 2024. The reference data in this report has been partly sourced from REFINITIV.
Technical Indicators Defined:
Support: A level at which the stock prices tend to find support if they are falling, and a downtrend may take a pause backed by demand or buying interest. Support 1 refers to the nearby support level for the stock and if the price breaches the level, then Support 2 may act as the crucial support level for the stock.
Resistance: A level at which the stock prices tend to find resistance when they are rising, and an uptrend may take a pause due to profit booking or selling interest. Resistance 1 refers to the nearby resistance level for the stock and if the price surpasses the level, then Resistance 2 may act as the crucial resistance level for the stock.
Stop-loss: It is a level to protect further losses in case of unfavourable movement in the stock prices.
The Green colour line reflects the 21-period moving average. SMA helps to identify existing price trends. If the prices are trading above the 21-period, prices are currently in a bullish trend (Vice – Versa).
The Blue colour line reflects the 50-period moving average. SMA helps to identify existing price trends. If the prices are trading above the 50-period, prices are currently in a bullish trend (Vice – Versa).
The Orange/ Yellow colour line represents the Trendline.
The Purple colour line in the chart’s lower segment reflects the Relative Strength Index (14-Period), which indicates price momentum and signals momentum in trend. A reading of 70 or above suggests overbought status, while a reading of 30 or below suggests an oversold status.
 AU
AU

 Please wait processing your request...