Company Overview: Cardno Limited (ASX: CDD) is a professional environmental services company which engages in the development and improvement of social infrastructure for communities in Ecuador and Peru and offers engineering and consulting services in Latin America. AnteoTech Limited (ASX: ADO) develops, commercializes, manufactures, and distributes products for clean energy technology and life science markets primarily in Australia, Asia, Europe, and North America. Mesoblast Limited (ASX: MSB) offers products in the areas of cardiovascular, spine orthopaedic disorder, oncology, haematology, and immune-mediated and inflammatory diseases in Australia, the United States, Singapore, and Switzerland. This Report covers the Price Action, Technical Indicators Analysis along with the Support Levels, Resistance Levels, and Recommendations on these stocks.
CDD’s Technical Analysis:
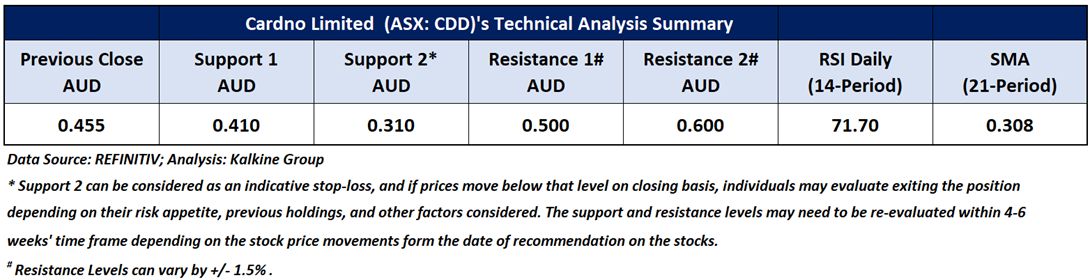
On the daily chart, CDD's stock price is rebounding from the lower boundary of a symmetrical triangle pattern, which might lead the stock to the pattern’s upper boundary. Additionally, the RSI (14-period) is heading north from the midpoint, providing further support for the mentioned recommendation. Prices are trading above both the 21-period and 50-day SMAs, which may potentially function as dynamic support levels for the stock; in contrast, the pattern’s upper boundary might act as a dynamic resistance level. Critical support for the stock is positioned at AUD 0.410, while key resistance is placed at AUD 0.500.

Daily Technical Chart – CDD
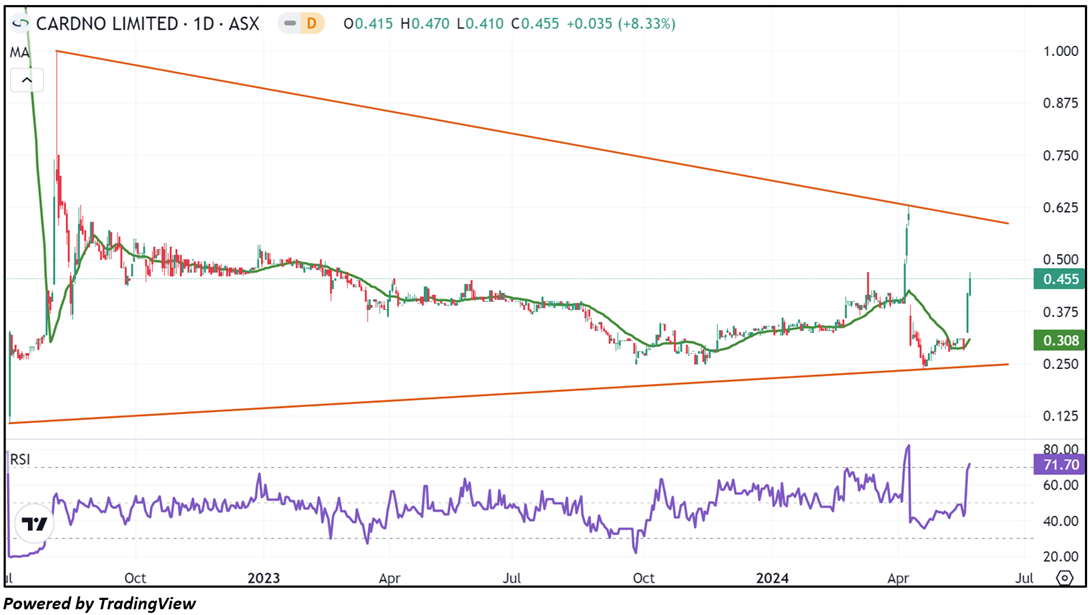
Considering the stock’s current price levels rebounding from the lower boundary of a symmetrical triangle pattern, and momentum oscillator analysis, a “Speculative Buy” recommendation is given on the stock. The stock was analysed as per the closing price of AUD 0.455 per share as on 22 May 2024, up by 8.33%. Cardno Limited (ASX: CDD) was last covered in a report dated ’09 April 2024’.
Recent Updates:
As on 31st March 2024, ADO had AUD1.6 million in cash with no debt obligations. Total cash receipts were AUD 1,38,000 and net cash outflow from operating activities stood at AUD 2,701,000 for the quarter ending 31st March 2024. The construction of Anteo X production facility has been completed in this quarter. ADO has received a grant of AUD 1.4 million from Queensland Critical Minerals and Battery Technology Fund.
On 14 May 2024, ADO announced that it has completed its Share Repurchase Plan, raising total of AUD 1.4mn. In April 2024, the company completed AUD 5.4mn share placement and unveiled a AUD 1mn share purchase plan, thus raising AUD 6.4mn in total. The shares are priced at 2.5 cents per share and included one for two attracting options at 3.5 cents. The main objective of this fundraising is to scale up the development and clean energy launch activities for Anteo X and Ultra high silicon anode.
ADO’s Technical Analysis:
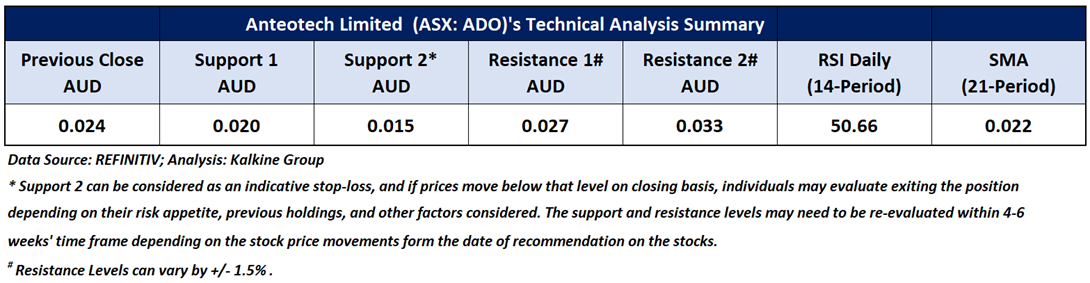
On the daily chart, ADO's stock price broke is rebounding from the lower edge of a downward slope channel, which might lead the stock to the channel’s upper edge. Moreover, the RSI (14-period) is heading north and surpassing the midpoint, adding further evidence to the previous observation. Prices are fluctuating between the 21-period and 50-day SMAs, which may potentially serve as dynamic support and resistance levels for the stock, respectively. Important support for the stock is positioned at AUD 0.020, while significant resistance is placed at AUD 0.027.

Daily Technical Chart – ADO
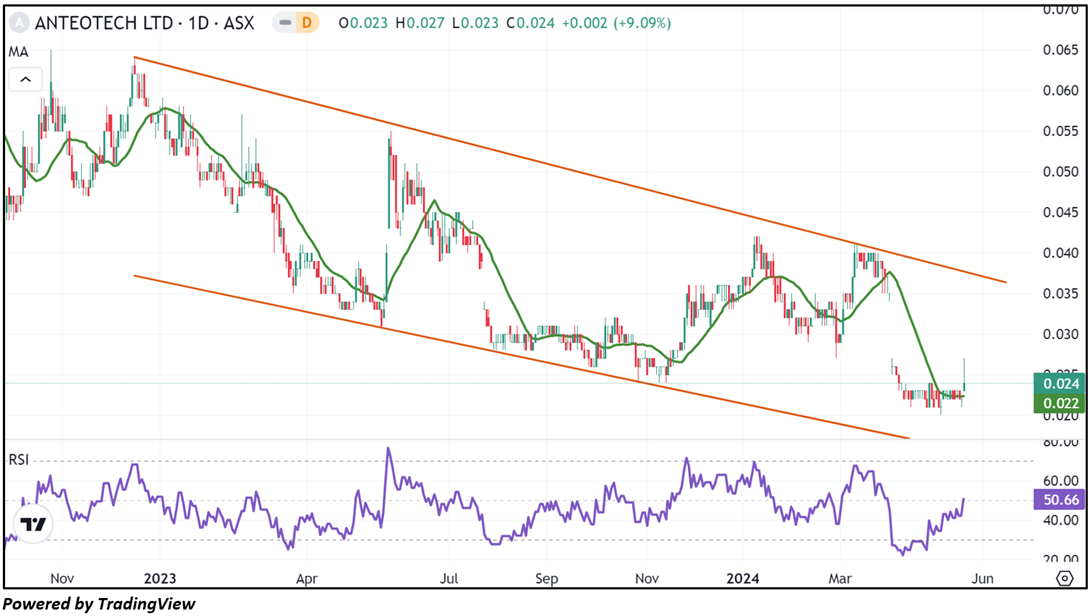
Considering the stock’s current price levels rebounding from the lower edge of a downward slope channel, and momentum oscillator analysis, a “Speculative Buy” recommendation is given on the stock. The stock was analysed as per the closing price of AUD 0.024 per share as on 22 May 2024, up by 9.09%. AnteoTech Limited (ASX: ADO) was last covered in a report dated ’11 January 2022’.
Recent Updates:
The United States Food and Drug Administration (FDA) has informed Mesoblast that their Phase 3 Study MSB-GVHD001 are sufficient to support the submission of the Biologics License Application (BLA) for remestemcel-L.
With the help of the entitlement offer and institutional placements, the company have raised gross proceeds of AUD 97mn in March 2024 quarter. MSB has reduced debt under its five-year facility and its minimum cash balance requirement by AUD 10mn during the quarter. As at 31 March 2024, cash balance stood at AUD 117mn. Also, the company has witnessed a decline of 28% in the net operating cash spend as compared to the same quarter last year.
MSB’s Technical Analysis:
Since the beginning of 2024, MSB's stock price is establishing a short-term uptrend characterized by higher highs and higher lows, indicating a positive bias. Additionally, the RSI (14-period) is heading north from the midpoint, providing further support for the previous analysis. Prices are trading above both the 21-period and 50-day SMAs, which may potentially function as dynamic support levels for the stock; in contrast, the stock’s most recent high might act as a resistance level. Crucial support for the stock is located at AUD 1.015, while key resistance is situated at AUD 1.212.
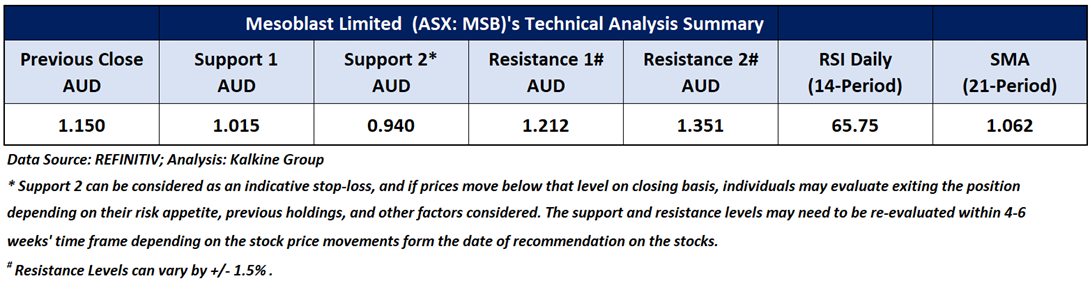

Daily Technical Chart – MSB
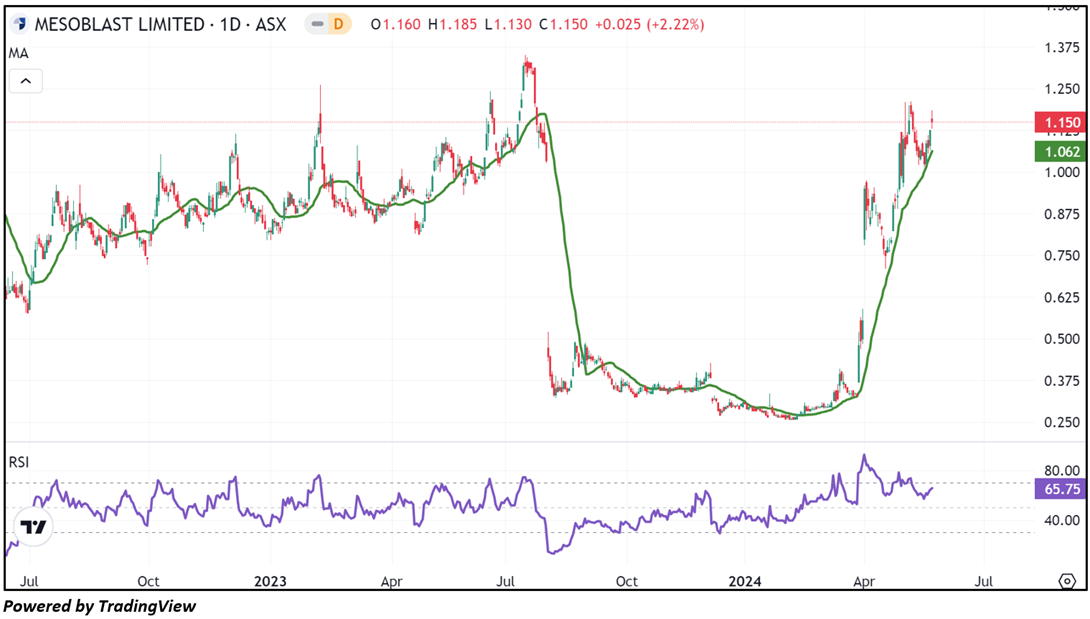
Considering the stock’s current price levels forming higher peaks and higher troughs, and momentum oscillator analysis, a “Speculative Buy” recommendation is given on the stock. The stock was analysed as per the closing price of AUD 1.150 per share as on 22 May 2024, up by 2.22%. Mesoblast Limited (ASX: MSB) was last covered in a report dated ’12 March 2024’.
Note 1: Past performance is neither an Indicator nor a guarantee of future performance.
Note 2: Investment decision should be made depending on an individual’s appetite for upside potential, risks, and any previous holdings. This recommendation is purely based on technical analysis, and fundamental analysis has not been considered in this report.
Note 3: Related Risks: This report may be looked at from high-risk perspective and recommendations are provided are for a short duration. Recommendations provided in this report are solely based on technical parameters, and the fundamental performance of the stocks has not been considered in the decision-making process. Other factors which could impact the stock prices include market risks, regulatory risks, interest rates risks, currency risks, social and political instability risks etc.
The reference date for all price data, currency, technical indicators, support, and resistance levels is May 22, 2024. The reference data in this report has been partly sourced from REFINITIV.
Technical Indicators Defined:
Support: A level at which the stock prices tend to find support if they are falling, and a downtrend may take a pause backed by demand or buying interest. Support 1 refers to the nearby support level for the stock and if the price breaches the level, then Support 2 may act as the crucial support level for the stock.
Resistance: A level at which the stock prices tend to find resistance when they are rising, and an uptrend may take a pause due to profit booking or selling interest. Resistance 1 refers to the nearby resistance level for the stock and if the price surpasses the level, then Resistance 2 may act as the crucial resistance level for the stock.
Stop-loss: It is a level to protect further losses in case of unfavourable movement in the stock prices.
The Green colour line reflects the 21-period moving average. SMA helps to identify existing price trends. If the prices are trading above the 21-period, prices are currently in a bullish trend (Vice – Versa).
The Blue colour line reflects the 50-period moving average. SMA helps to identify existing price trends. If the prices are trading above the 50-period, prices are currently in a bullish trend (Vice – Versa).
The Orange/ Yellow colour line represents the Trendline.
The Purple colour line in the chart’s lower segment reflects the Relative Strength Index (14-Period), which indicates price momentum and signals momentum in trend. A reading of 70 or above suggests overbought status, while a reading of 30 or below suggests an oversold status.
 AU
AU

 Please wait processing your request...