Company Overview: Metal Hawk Limited (ASX: MHK) engages in the evaluation, exploration, and development of mineral resource projects, exploring gold, lithium, and nickel sulphide deposits. GreenTech Metals Limited (ASX: GRE) engages in the exploration and development of mineral properties, exploring nickel, copper, zinc, gold, lithium, and cobalt deposits. Grange Resources Limited (ASX: GRR) owns and operates an integrated iron ore mining and pellet production business in Australia and internationally, involving in the mining, processing, and sale of iron ore; and exploration, evaluation, and development of mineral resources. This Report covers the Price Action, Technical Indicators Analysis along with the Support Levels, Resistance Levels, and Recommendations on these stocks.
Recent Updates:
For the quarter ending December 31, 2024, Metal Hawk successfully raised AUD 2.5 million through a well-supported placement. The company’s cash balance stood at AUD 3.6 million at the close of the quarter. Following the end of the period, Metal Hawk finalized the sale of a 70% interest in the Kanowna East project to Accelerate Resources Limited (ASX: AX8). This move aims to target major gold discoveries in the Kalgoorlie region while expanding exploration efforts to generate near-term value.
The company provided an exploration update for its wholly owned Leinster South project, situated 30km south of Leinster in Western Australia’s renowned Agnew-Lawlers region. Following the gold discovery at Siberian Tiger in August 2024, the company’s field activities are ongoing, defining new targets for its upcoming maiden drilling program at the Thylacine and Siberian Tiger prospects.
MHK’s Technical Analysis:
On the daily chart, MHK's stock price is consolidating within a trading range during an uptrend, indicating a potential continuation of the upward movement. Prices are trading between its previous peak and trough, which may potentially function as resistance and support levels for the stock, respectively. Crucial support for the stock is positioned at AUD 0.290, while key resistance is placed at AUD 0.330.
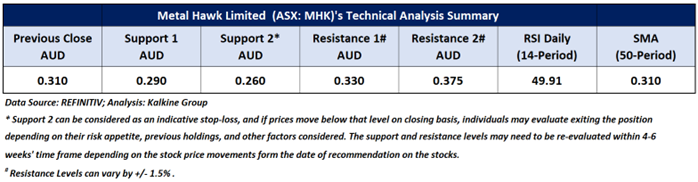

Daily Technical Chart – MHK
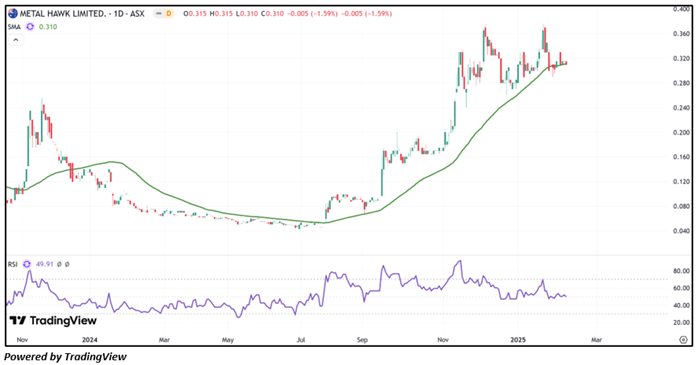
Considering the stock’s current price levels accumulating during an uptrend, and momentum oscillator analysis, a “Speculative Buy” recommendation is given on the stock. The stock was analysed as per the closing price of AUD 0.310 per share as on 07 February 2025, down by 1.59%. Metal Hawk Limited (ASX: MHK) was last covered in a report dated ’20 November 2023’.
Recent Updates:
Stage 2 Drilling Program
In mid-January 2025, GreenTech resumed its ~4,000m Stage 2 diamond core drilling program at its 100%-owned Whundo Cu-Zn project in the West Pilbara. The aim of this program is to test the potential for an increase in the Whundo Mineral Resource, which is currently estimated at 6.2Mt. The drilling campaign will be followed by downhole electromagnetic (DHEM) surveys on selected holes. A subsequent drill program is also in the works, focused on down plunge conductor targets associated with mineralised copper-zinc shoots at Austin, Shelby, Yannery, and Ayshia.
Commitment to Copper Exploration
GreenTech also plans to advance the Pilbara Copper Project. While lithium projects continue to be a compelling part of the company's portfolio, the immediate focus is on copper exploration. Further developments are anticipated in the coming months.
Financial Position
As of the end of the December quarter, GreenTech had approximately AUD 0.7mn in cash.
GRE’s Technical Analysis:
On the daily chart, GRE's broke above a descending wedge pattern, indicating a positive trend. Prices are trading below both the 21-period and 50-day SMAs, which may potentially function as dynamic resistance levels for the stock; in contrast, the stock’s most recent low might act as a support level. Crucial support for the stock is positioned at AUD 0.056, while key resistance is placed at AUD 0.074.
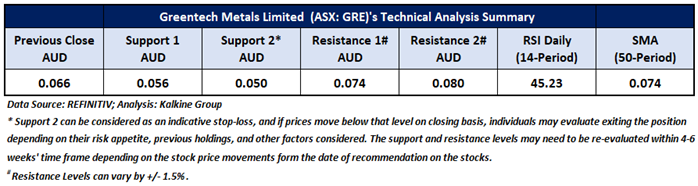

Daily Technical Chart – GRE
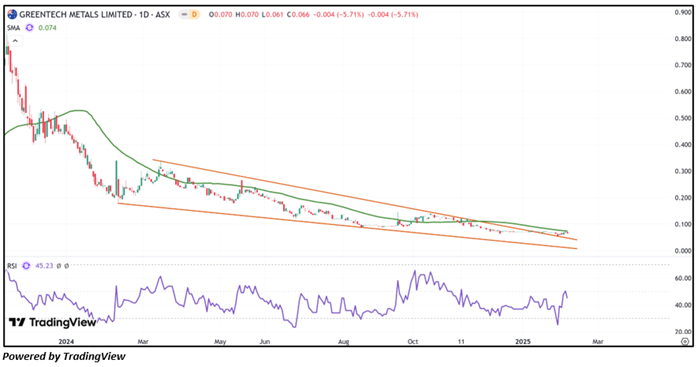
Considering the stock’s current price levels breaking above a descending wedge pattern, and momentum oscillator analysis, a “Speculative Buy” recommendation is given on the stock. The stock was analysed as per the closing price of AUD 0.066 per share as on 07 February 2025, down by 5.71%. GreenTech Metals Limited (ASX: GRE) was last covered in a report dated ’29 February 2024’.
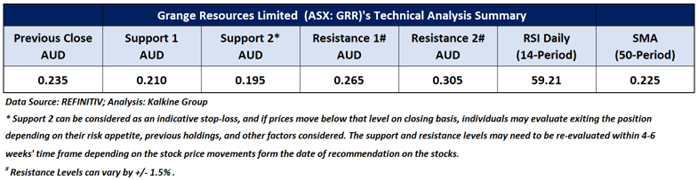
Key Insights on GRR:
Operational Performance: Grange Resources Ltd (ASX: GRR) delivered a positive performance in Q4 FY24 (for the quarter ended 31 December 2024), maintaining a Lost Time Injury-free record while achieving higher production and lower operating costs. The company’s cash and liquid investments increased to AU$298.05 million, up from AU$249.47 million in the previous quarter. Pellet sales rose 3.3% QoQ to 668kt, despite a delayed 80kt shipment due to adverse weather, which was completed on 1 January 2025. Concentrate production also improved to 683kt, driven by better weight recovery. Unit cash operating costs declined to AU$133.65/t from AU$146.37/t in Q3 FY24, benefiting from increased production efficiencies.
Progress on Growth Initiatives: In line with its long-term growth strategy, Grange successfully completed the first raise bore hole for the North Pit Underground Project (NPUG) and appointed BurnVoir Corporate Finance to arrange financing for its development.
Strategic Investments and Market Outlook: The company invested A$31.2 million during the quarter on key capital projects, including the Underground Exploration Decline, furnace relining, equipment rebuilds, and upgrades to the Savage River townsite. Commenting on the results, CEO Mr. Weidong Wang highlighted the company’s operational recovery following weather disruptions, attributing improved production and lower costs to the exceptional efforts of the workforce. He also noted that iron ore prices were supported by improved steel margins and stimulus measures in China.
GRR’s Technical Analysis:
On the daily chart, GRR's stock price broke above a symmetrical triangle pattern on the daily chart, signalling a positive trend. Additionally, the RSI (14-period) is fluctuating between 40 and 80, providing further support for the mentioned recommendation. Prices are trading above both the 21-period and 50-day SMAs, which may potentially function as dynamic support levels for the stock; in contrast, the stock’s most recent high might act as a resistance level. Crucial support for the stock is positioned at AUD 0.210, while key resistance is placed at AUD 0.265.

Daily Technical Chart – GRR
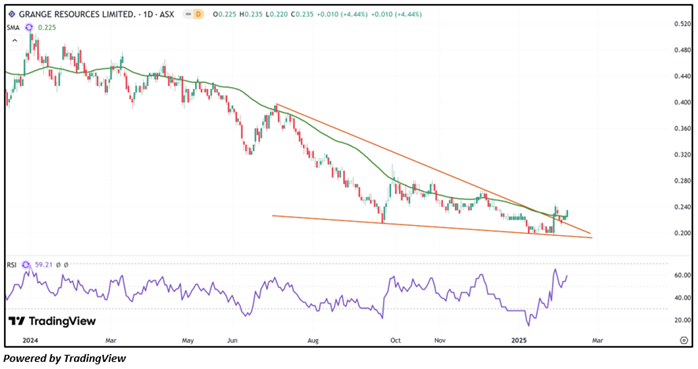
Considering the stock’s current price levels breaking above a descending wedge pattern, and momentum oscillator analysis, a “Speculative Buy” recommendation is given on the stock. The stock was analysed as per the closing price of AUD 0.235 per share as on 07 February 2025, up by 4.44%. Grange Resources Limited (ASX: GRR) was last covered in a report dated ’28 May 2024’.
Note 1: Past performance is neither an Indicator nor a guarantee of future performance.
Note 2: Investment decision should be made depending on an individual’s appetite for upside potential, risks, and any previous holdings. This recommendation is purely based on technical analysis, and fundamental analysis has not been considered in this report.
Note 3: Related Risks: This report may be looked at from high-risk perspective and recommendations are provided are for a short duration. Recommendations provided in this report are solely based on technical parameters, and the fundamental performance of the stocks has not been considered in the decision-making process. Other factors which could impact the stock prices include market risks, regulatory risks, interest rates risks, currency risks, social and political instability risks etc.
The reference date for all price data, currency, technical indicators, support, and resistance levels is February 07, 2025. The reference data in this report has been partly sourced from REFINITIV.
Technical Indicators Defined:
Support: A level at which the stock prices tend to find support if they are falling, and a downtrend may take a pause backed by demand or buying interest. Support 1 refers to the nearby support level for the stock and if the price breaches the level, then Support 2 may act as the crucial support level for the stock.
Resistance: A level at which the stock prices tend to find resistance when they are rising, and an uptrend may take a pause due to profit booking or selling interest. Resistance 1 refers to the nearby resistance level for the stock and if the price surpasses the level, then Resistance 2 may act as the crucial resistance level for the stock.
Stop-loss: It is a level to protect further losses in case of unfavourable movement in the stock prices.
The Green colour line reflects the 21-period moving average. SMA helps to identify existing price trends. If the prices are trading above the 21-period, prices are currently in a bullish trend (Vice – Versa).
The Blue colour line reflects the 50-period moving average. SMA helps to identify existing price trends. If the prices are trading above the 50-period, prices are currently in a bullish trend (Vice – Versa).
The Orange/ Yellow colour line represents the Trendline.
The Purple colour line in the chart’s lower segment reflects the Relative Strength Index (14-Period), which indicates price momentum and signals momentum in trend. A reading of 70 or above suggests overbought status, while a reading of 30 or below suggests an oversold status.
 AU
AU
 Please wait processing your request...