Company Overview: TPG Telecom Limited (ASX: TPG) provides telecommunications services to consumer, business, enterprise, and government and wholesale customers in Australia, owning and operating fixed and mobile telecommunication services. This Report covers the Price Action, Technical Indicators Analysis along with the Support Levels, Resistance Levels, and Recommendations on this stock.
Recent News:
On 5 September 2024, the ACCC decided not to oppose the regional mobile network and spectrum sharing agreements between Optus Mobile Pty Ltd and TPG Telecom Limited (ASX: TPG).
- These agreements enable Optus to utilize TPG's spectrum for mobile services in specific regional areas while providing TPG with network services. TPG will decommission most of its sites in these areas, transferring some to Optus. Both companies will maintain their independent networks in metropolitan regions, serving 81.6% of Australia’s population.
- After evaluating the agreements' impact on competition, the ACCC concluded that they are unlikely to significantly reduce competition in retail and wholesale mobile services. ACCC Commissioner Dr. Philip Williams noted that the arrangement would enhance TPG's coverage in regional areas, improving consumer choices. Furthermore, it is expected to support Optus’ regional 5G rollout.
- While the ACCC found no substantial competition concerns, it acknowledged that the agreements represent a significant structural shift in the mobile market and will continue to monitor the situation. The agreements include a Multi-Operator Core Network (MOCN) arrangement for an initial term of 11 years, with an option for TPG to extend by five years.
H1 FY24 Results (for Half Year Ended 30 June 2024)
- On 30 August 2024, TPG announced H1 FY24 results, with service revenue increasing by 1.7% YoY to AU$2,327 million. Mobile service revenue saw a rise of 7.2% YoY to AU$1,121 million. EBITDA grew by 3.5% YoY to AU$974 million, while EBITDA excluding one-off items increased by 2.2% YoY to AU$979 million. Operating free cash flow surged by AU$340 million to AU$278 million, and an interim dividend of 9.0 cents per share was declared.
- CEO Iñaki Berroeta noted that the growth in the Mobile segment reflects the company's commitment to providing value-driven plans amid rising demand, despite a slowdown in subscriber growth. The rollout of Fixed Wireless products has also helped mitigate competition in the NBN market. The company is actively managing costs, recently eliminating 120 roles to address sustained inflation. TPG Telecom is focused on executing its strategy, including advancing its regional network sharing arrangement with Optus and conducting a strategic review of its fibre infrastructure.
- FY24 Guidance Update: TPG Telecom is on track to achieve the mid-point of its previously stated FY24 EBITDA guidance, which ranges from AU$1,950 million to AU$2,025 million, assuming stable operating conditions and excluding any material one-off items.
TPG’s Technical Analysis:
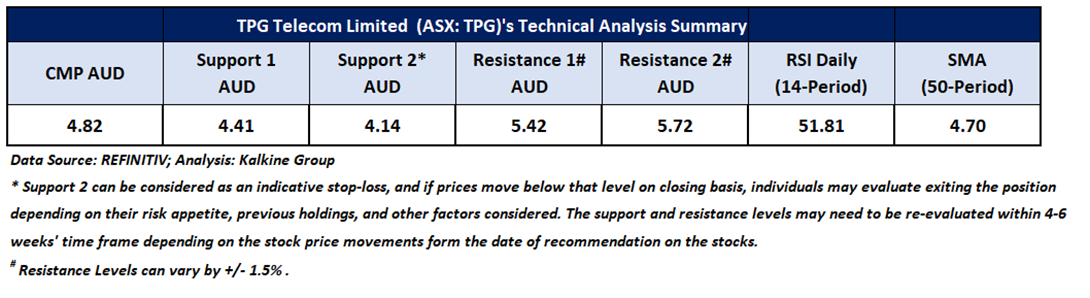
On the daily chart, TPG's stock price broke above both the descending wedge pattern as well as its previous peak, signalling a positive trend. Currently, though experiencing a minor correction, the stock is rebounding from significant support established by the July 2024 peak, providing further support for the mentioned recommendation. Prices are trading between its previous peak and trough, which may potentially function as resistance and support levels for the stock, respectively. Critical support for the stock is positioned at AUD 4.41, while key resistance is placed at AUD 5.42.

Daily Technical Chart – TPG
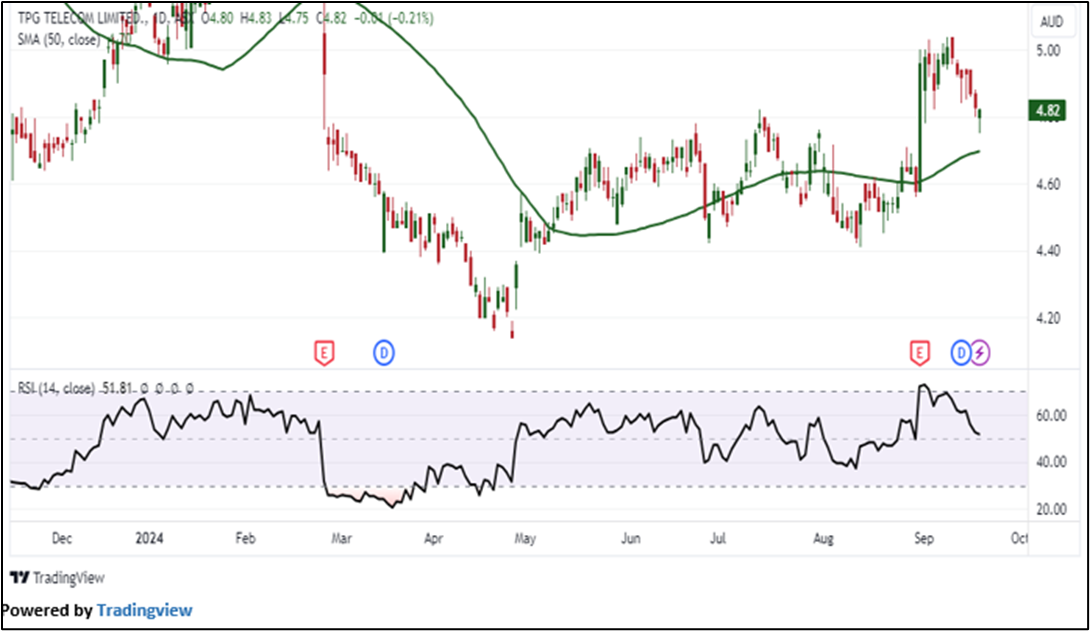
Considering the stock’s current price levels surpassing a descending wedge pattern as well as its previous peak, and momentum oscillator analysis, a “Buy” recommendation is given on the stock. The stock was analysed as per the current price of AUD 4.82 as of September 18, 2024, at 11:25 AM, Sydney, Australia, AEST. TPG Telecom Limited (ASX: TPG) was last covered in a report dated ’29 July 2024’.
Note 1: Past performance is neither an Indicator nor a guarantee of future performance.
Note 2: Investment decision should be made depending on an individual’s appetite for upside potential, risks, and any previous holdings. This recommendation is purely based on technical analysis, and fundamental analysis has not been considered in this report.
Note 3: Related Risks: This report may be looked at from high-risk perspective and recommendations are provided are for a short duration. Recommendations provided in this report are solely based on technical parameters, and the fundamental performance of the stocks has not been considered in the decision-making process. Other factors which could impact the stock prices include market risks, regulatory risks, interest rates risks, currency risks, social and political instability risks etc.
The reference date for all price data, currency, technical indicators, support, and resistance levels is September 18, 2024, at 11:25 AM, Sydney, Australia, AEST. The reference data in this report has been partly sourced from REFINITIV.
Technical Indicators Defined:
Support: A level at which the stock prices tend to find support if they are falling, and a downtrend may take a pause backed by demand or buying interest. Support 1 refers to the nearby support level for the stock and if the price breaches the level, then Support 2 may act as the crucial support level for the stock.
Resistance: A level at which the stock prices tend to find resistance when they are rising, and an uptrend may take a pause due to profit booking or selling interest. Resistance 1 refers to the nearby resistance level for the stock and if the price surpasses the level, then Resistance 2 may act as the crucial resistance level for the stock.
Stop-loss: It is a level to protect further losses in case of unfavourable movement in the stock prices.
The Green colour line reflects the 21-period moving average. SMA helps to identify existing price trends. If the prices are trading above the 21-period, prices are currently in a bullish trend (Vice – Versa).
The Blue colour line reflects the 50-period moving average. SMA helps to identify existing price trends. If the prices are trading above the 50-period, prices are currently in a bullish trend (Vice – Versa).
The Orange/ Yellow colour line represents the Trendline.
The Purple colour line in the chart’s lower segment reflects the Relative Strength Index (14-Period), which indicates price momentum and signals momentum in trend. A reading of 70 or above suggests overbought status, while a reading of 30 or below suggests an oversold status.
 AU
AU

 Please wait processing your request...