Company Overview: Elsight Limited (ASX: ELS) is a technology company focused on providing connectivity solutions for unmanned aerial and ground systems, such as drones and robots. This Report covers the Price Action, Technical Indicators Analysis along with the Support Levels, Resistance Levels, and Recommendations on this stock.
Key Recent Updates:
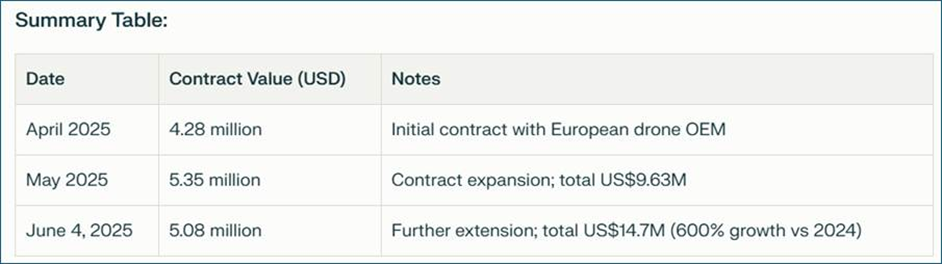
- 23 June 2025: ELS announced US$1.35 million shipment delivered to a European defence OEM customer, demonstrating supply chain strength amid Middle East conflict. Year-to-date revenue exceeded US$4.4 million (A$6.7 million), more than double total 2024 revenue, with further growth expected in the second half of 2025.
- 4 June 2025: Elsight signed a further US$5.08 million contract extension with the same European defence OEM, increasing total 2025 contracts to US$14.7 million (~AU$22.9 million), representing a 600% revenue increase over 2024.
- 29 May 2025: The same customer expanded the contract by an additional US$5.35 million, bringing total 2025 orders to US$9.63 million (~AU$15 million)
- 23 April 2025: Elsight signed a US$4.28 million contract with a European defence drone OEM for supply of its Halo connectivity platform
These contracts support delivery of Halo units throughout 2025, underpinning Elsight’s growth in defence unmanned systems connectivity. The company expects these orders to drive profitability and cash flow break-even in 2025, with better production capacity and supply chain readiness to meet demand.
(Source: Company Filings; Analysis by Kalkine Group)
ELS’ Technical Analysis:
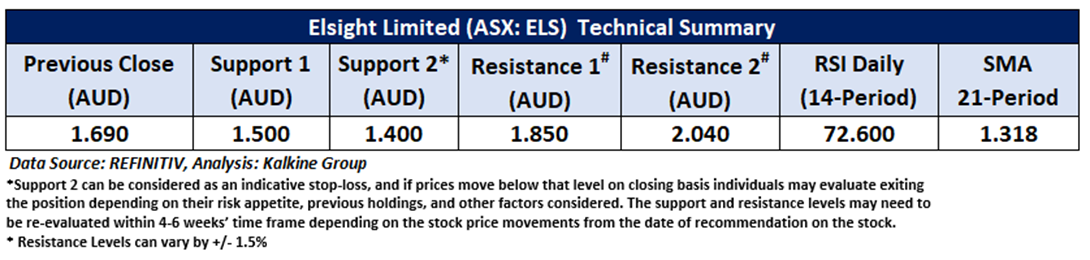
On the daily chart, ELS prices are holding above the rising trendline support level, indicating continued bullish momentum. The 14-period Relative Strength Index (RSI) is currently around 72.60, reflecting strong positive momentum and slightly overbought conditions. Additionally, prices are trading above the 21-period Simple Moving Average (SMA), which may continue to act as dynamic support. An important support level for the stock is at AUD 1.500, while key resistance is seen at AUD 1.850.

Daily Technical Chart – ELS
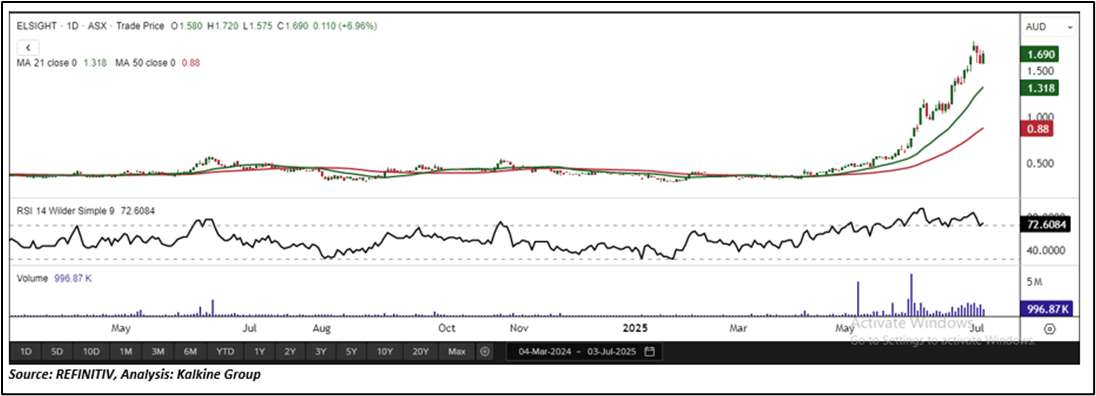
Considering the stock’s current price levels forming higher peaks and higher troughs, and momentum oscillator analysis, a “Speculative Buy” recommendation is given on the stock. The stock was analysed as per the closing price of AUD 1.690 per share as on 03 July 2025, up by 6.96%. Elsight Limited (ASX: ELS) was last covered in a report dated ’19 February 2025’.
Note 1: Past performance is neither an Indicator nor a guarantee of future performance.
Note 2: Investment decision should be made depending on an individual’s appetite for upside potential, risks, and any previous holdings. This recommendation is purely based on technical analysis, and fundamental analysis has not been considered in this report.
Note 3: Related Risks: This report may be looked at from high-risk perspective and recommendations are provided are for a short duration. Recommendations provided in this report are solely based on technical parameters, and the fundamental performance of the stocks has not been considered in the decision-making process. Other factors which could impact the stock prices include market risks, regulatory risks, interest rates risks, currency risks, social and political instability risks etc.
The reference date for all price data, currency, technical indicators, support, and resistance levels is July 03, 2025. The reference data in this report has been partly sourced from REFINITIV.
Technical Indicators Defined:
Support: A level at which the stock prices tend to find support if they are falling, and a downtrend may take a pause backed by demand or buying interest. Support 1 refers to the nearby support level for the stock and if the price breaches the level, then Support 2 may act as the crucial support level for the stock.
Resistance: A level at which the stock prices tend to find resistance when they are rising, and an uptrend may take a pause due to profit booking or selling interest. Resistance 1 refers to the nearby resistance level for the stock and if the price surpasses the level, then Resistance 2 may act as the crucial resistance level for the stock.
Stop-loss: It is a level to protect further losses in case of unfavourable movement in the stock prices.
The Green colour line reflects the 21-period moving average. SMA helps to identify existing price trends. If the prices are trading above the 21-period, prices are currently in a bullish trend (Vice – Versa).
The Blue colour line reflects the 50-period moving average. SMA helps to identify existing price trends. If the prices are trading above the 50-period, prices are currently in a bullish trend (Vice – Versa).
The Orange/ Yellow colour line represents the Trendline.
The Purple colour line in the chart’s lower segment reflects the Relative Strength Index (14-Period), which indicates price momentum and signals momentum in trend. A reading of 70 or above suggests overbought status, while a reading of 30 or below suggests an oversold status.
 AU
AU

 Please wait processing your request...