Company Overview: Bubs Australia Limited (ASX: BUB) is an Australia-based company engaged in providing a range of organic baby food, goat milk infant formula products, adult goat milk powder products and fresh dairy products. It also provides canning services for nutritional dairy products. This Report covers the Price Action, Technical Indicators Analysis along with the Support Levels, Resistance Levels, and Recommendations on this stock.
Results Update: In 1HFY25, the company reported a remarkable turnaround, posting a net profit after tax of AUD 3.6mn, a significant improvement from the net loss of AUD 7.7mn in 1HY24. EBITDA also showed positive growth, reaching AUD 0.5mn in 1HFY25, reversing the previous year's loss of AUD 7.0mn. Revenue increased by 23% year-on-year, totaling AUD 48.5mn for the period. Operating cash flow saw substantial improvement, with net cash being used reduced to AUD 0.5mn in 1HFY25, compared to AUD 12.2mn in the same period last year. The gross margin slightly improved to 50%, up from 49% in the prior year.
Outlook: The company has reiterated its FY25 outlook, projecting AUD 102mn in revenue and EBITDA breakeven, along with an upgraded gross margin forecast of 45%. Furthermore, the Growth Monitoring Study achieved full patient enrolment by December 2024, and an FDA decision on permanent access is expected by October 2025.
BUB’s Technical Analysis:
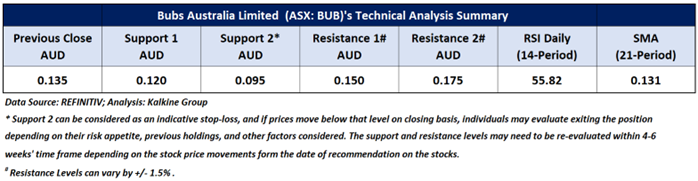
On the daily chart, BUB's stock price broke above a descending wedge pattern, signalling a positive trend. Additionally, the RSI (14-period) is heading north from its midpoint, providing further support for the mentioned recommendation. Prices are trading above both the 21-period and 50-day SMAs, which may potentially function as dynamic support levels for the stock; in contrast, the stock’s most recent high might act as a resistance level. Crucial support for the stock is positioned at AUD 0.120, while key resistance is placed at AUD 0.150.

Daily Technical Chart – BUB
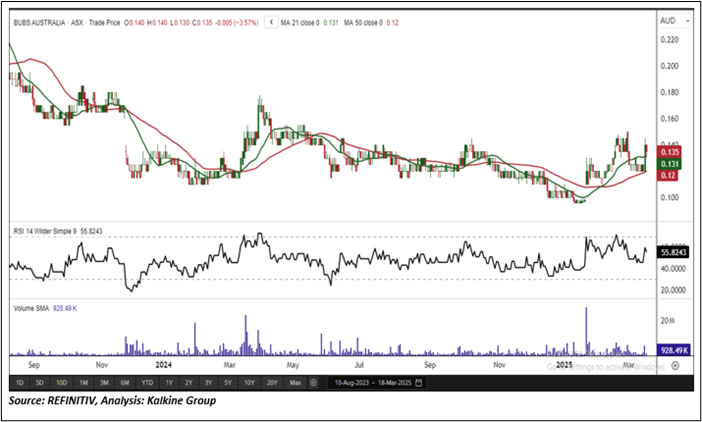
Considering the stock’s current price levels breaking above a descending wedge pattern, and momentum oscillator analysis, a “Speculative Buy” recommendation is given on the stock. The stock was analysed as per the closing price of AUD 0.135 per share as on 18 March 2025, down by 3.57%. Bubs Australia Limited (ASX: BUB) was last covered in a report dated ’27 March 2024’.
Note 1: Past performance is neither an Indicator nor a guarantee of future performance.
Note 2: Investment decision should be made depending on an individual’s appetite for upside potential, risks, and any previous holdings. This recommendation is purely based on technical analysis, and fundamental analysis has not been considered in this report.
Note 3: Related Risks: This report may be looked at from high-risk perspective and recommendations are provided are for a short duration. Recommendations provided in this report are solely based on technical parameters, and the fundamental performance of the stocks has not been considered in the decision-making process. Other factors which could impact the stock prices include market risks, regulatory risks, interest rates risks, currency risks, social and political instability risks etc.
The reference date for all price data, currency, technical indicators, support, and resistance levels is March 18, 2025. The reference data in this report has been partly sourced from REFINITIV.
Technical Indicators Defined:
Support: A level at which the stock prices tend to find support if they are falling, and a downtrend may take a pause backed by demand or buying interest. Support 1 refers to the nearby support level for the stock and if the price breaches the level, then Support 2 may act as the crucial support level for the stock.
Resistance: A level at which the stock prices tend to find resistance when they are rising, and an uptrend may take a pause due to profit booking or selling interest. Resistance 1 refers to the nearby resistance level for the stock and if the price surpasses the level, then Resistance 2 may act as the crucial resistance level for the stock.
Stop-loss: It is a level to protect further losses in case of unfavourable movement in the stock prices.
The Green colour line reflects the 21-period moving average. SMA helps to identify existing price trends. If the prices are trading above the 21-period, prices are currently in a bullish trend (Vice – Versa).
The Blue colour line reflects the 50-period moving average. SMA helps to identify existing price trends. If the prices are trading above the 50-period, prices are currently in a bullish trend (Vice – Versa).
The Orange/ Yellow colour line represents the Trendline.
The Purple colour line in the chart’s lower segment reflects the Relative Strength Index (14-Period), which indicates price momentum and signals momentum in trend. A reading of 70 or above suggests overbought status, while a reading of 30 or below suggests an oversold status.
 AU
AU

 Please wait processing your request...