Company Overview: Dateline Resources Limited (ASX: DTR) is an Australian-based mining and exploration company headquartered in Sydney. The company focuses on the exploration and development of mineral properties across North America, with a primary emphasis on gold, rare earth elements, copper, and strontium. This Report covers the Price Action, Technical Indicators Analysis along with the Support Levels, Resistance Levels, and Recommendations on this stock.
Recent Updates:
On May 5, 2025, the company announced the commencement of a rare earths-focused drilling program aimed at expanding and better defining the REE mineralization alongside gold. The Colosseum project hosts a JORC-compliant resource of 27.1 million tonnes at 1.26 g/t gold for 1.1 million ounces of gold, with a strategic location just north of the Mountain Pass mine, the USA’s only operating rare earth mine. This drilling initiative is supervised by global REE experts and aligns with U.S. federal policy to secure domestic critical mineral supplies.
In a strategic portfolio move, Dateline sold its non-core Udu copper project in Fiji to Viva Metals Pty Ltd for up to AUD 4.35 million on May 13, 2025. The consideration includes cash, equity, and contingent payments. This divestment allows Dateline to concentrate its financial and operational resources on the Colosseum project, which has garnered significant government and investor attention due to its dual gold and rare earth potential. The proceeds from the sale will be used to fund the ongoing Bankable Feasibility Study (BFS) and exploration activities at Colosseum.
Dateline is also progressing its listing on the OTCQB Venture Market in the United States, targeting Q3 2025. This upgrade from its current OTC Pink status will enhance transparency, liquidity, and access to a broader pool of U.S. institutional and retail investors.
In a nutshell, Dateline Resources is strategically repositioning itself by divesting non-core assets, advancing a comprehensive drilling and feasibility program at Colosseum, and expanding its investor base through the OTCQB listing. These developments position the company well to capitalize on the growing demand for critical minerals and gold in the United States, supporting long-term value creation for shareholders.
DTR’s Technical Analysis:
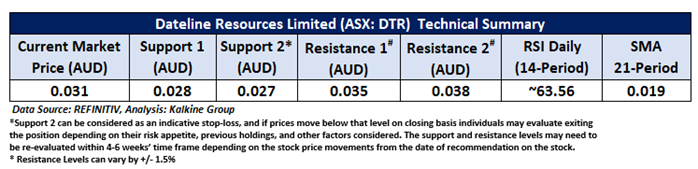
On the daily chart, DTR is trading above a key horizontal support zone, reflecting price stability and consistent buying interest. The 14-period Relative Strength Index (RSI) is at approximately 63.56, suggesting bullish momentum without being overbought. The stock also remains above the 21-period Simple Moving Average (SMA), which acts as dynamic support and reinforces the prevailing uptrend. Key technical levels to watch are support at AUD 0.028 and resistance at AUD 0.035. A decisive breakout above the resistance level could open the door for further upside potential.

Daily Technical Chart – DTR
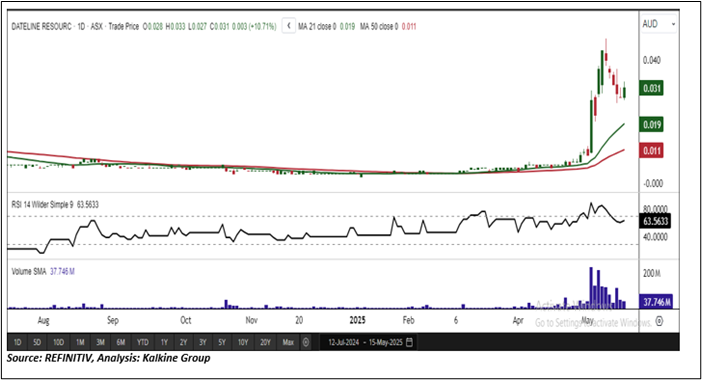
Considering the stock’s current price levels are trading above the horizontal trendline support, and momentum oscillator analysis, a “Speculative Buy” recommendation is given on the stock. The stock was analysed as per the current market price of AUD 0.031 per share as on 15 May 2025 at 2:55 PM AEST, up by 10.71%.
Note 1: Past performance is neither an Indicator nor a guarantee of future performance.
Note 2: Investment decision should be made depending on an individual’s appetite for upside potential, risks, and any previous holdings. This recommendation is purely based on technical analysis, and fundamental analysis has not been considered in this report.
Note 3: Related Risks: This report may be looked at from high-risk perspective and recommendations are provided are for a short duration. Recommendations provided in this report are solely based on technical parameters, and the fundamental performance of the stocks has not been considered in the decision-making process. Other factors which could impact the stock prices include market risks, regulatory risks, interest rates risks, currency risks, social and political instability risks etc.
The reference date for all price data, currency, technical indicators, support, and resistance levels is May 15, 2025. The reference data in this report has been partly sourced from REFINITIV.
Technical Indicators Defined:
Support: A level at which the stock prices tend to find support if they are falling, and a downtrend may take a pause backed by demand or buying interest. Support 1 refers to the nearby support level for the stock and if the price breaches the level, then Support 2 may act as the crucial support level for the stock.
Resistance: A level at which the stock prices tend to find resistance when they are rising, and an uptrend may take a pause due to profit booking or selling interest. Resistance 1 refers to the nearby resistance level for the stock and if the price surpasses the level, then Resistance 2 may act as the crucial resistance level for the stock.
Stop-loss: It is a level to protect further losses in case of unfavourable movement in the stock prices.
The Green colour line reflects the 21-period moving average. SMA helps to identify existing price trends. If the prices are trading above the 21-period, prices are currently in a bullish trend (Vice – Versa).
The Blue colour line reflects the 50-period moving average. SMA helps to identify existing price trends. If the prices are trading above the 50-period, prices are currently in a bullish trend (Vice – Versa).
The Orange/ Yellow colour line represents the Trendline.
The Purple colour line in the chart’s lower segment reflects the Relative Strength Index (14-Period), which indicates price momentum and signals momentum in trend. A reading of 70 or above suggests overbought status, while a reading of 30 or below suggests an oversold status.
 AU
AU
 Please wait processing your request...