Company Overview: Decidr AI Industries Ltd (ASX: DAI) is an Australia-based artificial intelligence (AI) enablement company with a controlling interest in the AI platform Decidr.ai. The company owns and operates Edible Beauty Australia, a skincare and supplements brand, alongside its Decidr AI platform, reflecting its dual focus on consumer wellness and technology-driven innovation. This Report covers the Price Action, Technical Indicators Analysis along with the Support Levels, Resistance Levels, and Recommendations on this stock.
Operational Developments & Outlook:
During the period, DAI accelerated its transition into a pure-play agentic AI platform through full ownership of Decidr and subsequent expansion into the US via Sugarwork, while divesting non-core assets such as 13 Seeds to sharpen strategic focus. The business is positioning itself as an orchestration-layer provider in the AI stack, targeting enterprise adoption of agentic systems through its “capture–coordinate–compound” model, combining DecidrOS and Sugarwork to enable workflow automation and knowledge capture. Recent progress includes expansion of embedded partnerships, reseller channels across the US, Australia and Singapore, and early enterprise deployments, alongside positive traction in annualised revenue run-rate exiting Q3 FY26. Looking ahead, management is focused on scaling enterprise adoption, international expansion (particularly in sovereign AI markets), and leveraging its growing partner ecosystem to drive recurring SaaS revenues and network effects.
Financials (AUD million):
For H1 FY26, DAI reported revenue of AUD 1.82m (+64% YoY) and gross margin of AUD 1.12m, reflecting early commercial traction across both AI software and legacy product segments. However, profitability declined materially with underlying EBITDA loss of AUD (8.95)m and EBIT loss of AUD (14.93)m, primarily driven by elevated operating costs, technology amortisation (~AUD 5.98m), and continued investment in platform development and scaling. The company recorded a net loss after tax of AUD (17.23)m, compared to a prior-year profit boosted by one-off fair value gains. Cash position strengthened to AUD 21.32m (vs AUD 7.75m at FY25), supported by ~AUD 28.3m in equity raises and option exercises, providing funding runway for growth initiatives despite operating cash outflow of ~AUD (9.18)m.
DAI’s Technical Analysis:
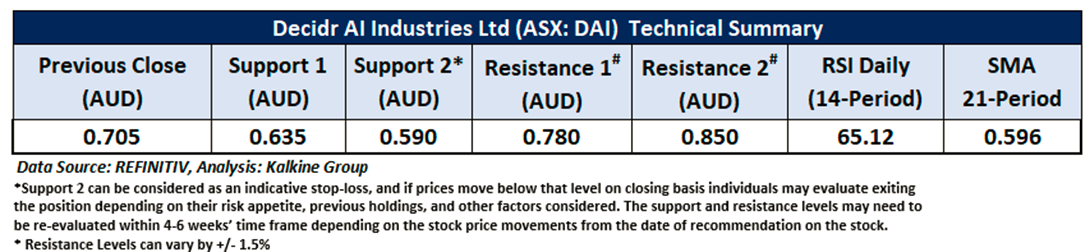
On the daily chart, DAI continues to hold above a rising trendline support, indicating potential for further upside in the near term. The 14-period Relative Strength Index (RSI) stands at 65.12, reflecting bullish momentum and positive sentiment. Additionally, the price remains above the 21-period Simple Moving Average (SMA), reinforcing the prevailing uptrend structure. Immediate support is seen near AUD 0.635, while key resistance is placed at AUD 0.780. A sustained breakout above this resistance level could further strengthen bullish momentum and open the door for additional gains.

Daily Technical Chart – DAI
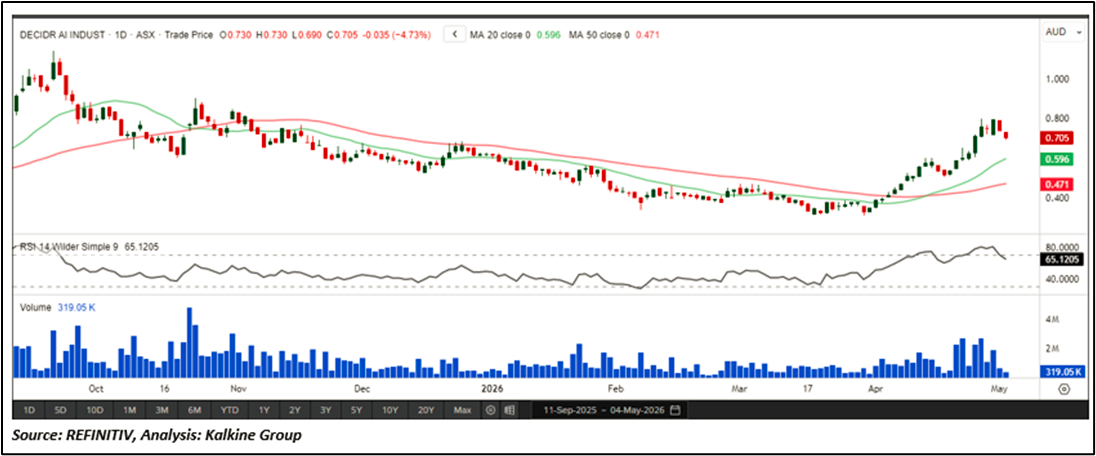
Considering the stock’s current prices are trading above the falling trendline support, and momentum oscillator analysis, a “Speculative Buy” recommendation is given on the stock. The stock was analysed as per the closing price of AUD 0.705 per share as on May 04, 2026.
Note 1: Past performance is neither an Indicator nor a guarantee of future performance.
Note 2: Investment decision should be made depending on an individual’s appetite for upside potential, risks, and any previous holdings. This recommendation is purely based on technical analysis, and fundamental analysis has not been considered in this report.
Note 3: Related Risks: This report may be looked at from high-risk perspective and recommendations are provided are for a short duration. Recommendations provided in this report are solely based on technical parameters, and the fundamental performance of the stocks has not been considered in the decision-making process. Other factors which could impact the stock prices include market risks, regulatory risks, interest rates risks, currency risks, social and political instability risks etc.
The reference date for all price data, currency, technical indicators, support, and resistance levels is May 04, 2026. The reference data in this report has been partly sourced from REFINITIV.
Technical Indicators Defined:
Support: A level at which the stock prices tend to find support if they are falling, and a downtrend may take a pause backed by demand or buying interest. Support 1 refers to the nearby support level for the stock and if the price breaches the level, then Support 2 may act as the crucial support level for the stock.
Resistance: A level at which the stock prices tend to find resistance when they are rising, and an uptrend may take a pause due to profit booking or selling interest. Resistance 1 refers to the nearby resistance level for the stock and if the price surpasses the level, then Resistance 2 may act as the crucial resistance level for the stock.
Stop-loss: It is a level to protect further losses in case of unfavourable movement in the stock prices.
The Green colour line reflects the 21-period moving average. SMA helps to identify existing price trends. If the prices are trading above the 21-period, prices are currently in a bullish trend (Vice – Versa).
The Blue colour line reflects the 50-period moving average. SMA helps to identify existing price trends. If the prices are trading above the 50-period, prices are currently in a bullish trend (Vice – Versa).
The Orange/ Yellow colour line represents the Trendline.
The Purple colour line in the chart’s lower segment reflects the Relative Strength Index (14-Period), which indicates price momentum and signals momentum in trend. A reading of 70 or above suggests overbought status, while a reading of 30 or below suggests an oversold status.

 CA
 NZ
 UK
 US
 IND

 AU

 Please wait processing your request...