Company Overview: Westpac Banking Corporation (ASX: WBC) provides various banking and financial services in Australia, New Zealand, and internationally, including Consumer, Business, Consumer and Business Banking, Westpac Institutional Bank, Specialist Businesses, and Westpac New Zealand. This Report covers the Price Action, Technical Indicators Analysis along with the Support Levels, Resistance Levels, and Recommendations on this stock.
Latest Announcement: On 28 August 2024, WBC announced the suspension and removal of Notes (ASX Code: WBCHCW) from official quotation. The AU$1,000,000,000 Floating Rate Notes maturing 27 August 2029 was suspended at the closing of 28 August 2024. The Notes will be removed from Official Quotation with effect from the close of trading on Thursday, 29 August 2024.
Pillar 3 Report:
- As on 30 June 2024 (third quarter end of FY24), WBC reported that Level 2 CET1 capital ratio was 11.96%, 59 basis points (bps) lower than 31 March 2024. The decline was due to payment of the 2024 interim dividend, on market buyback, and an increase in total Risk Weighted Assets (RWA).
- During Q3 FY24, Total RWA increased by 1.6% to $451.7 billion, due to increases in both credit and non-credit RWA.
- As on 30 June 2024, Westpac’s leverage ratio was 5.38%, down 11 bps from 31 March 2024. The ratio remains well above APRA's regulatory minimum requirement of 3.5%.
Key Highlights of Q3 FY24 Trading Update
- For the three months ended 30 June 2024 (Q3 FY24), WBC reported unaudited net profit of AU$1.8 billion, which was 6% up compared to the first half 2024 quarterly average.
- WBC has raised AU$36 billion of new long-term wholesale funding in the financial year to date. Subsequently, the Group reported quarterly average liquidity coverage ratio of 130% and net stable funding ratio of 113%, which remained above the regulatory minimum requirements.
- Riks: The cost of living and high interest rates remained a challenge for some customers while many businesses are likely to face cost pressures and experience lower demand.
WBC’s Technical Analysis:
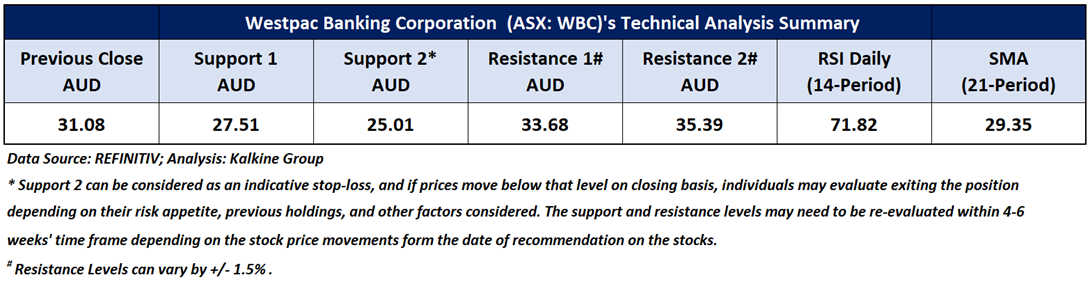
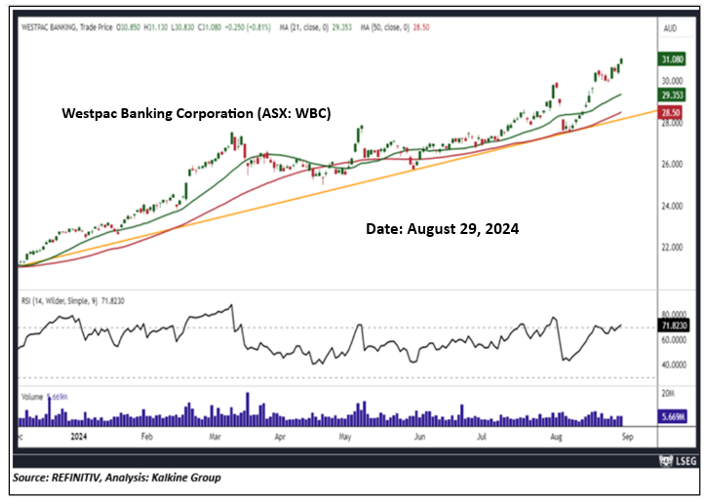
On the daily chart, WBC's stock price is undergoing an uptrend characterized by higher highs and higher lows established since October 2023, indicating a positive bias. In contrast, the RSI (14-period) is forming a top divergence in relation to prices, anticipating a potential minor correction. Prices are trading above both the 21-period and 50-day SMAs, which may potentially function as dynamic support levels for the stock; in contrast, the stock’s previous highs might act as resistance levels. Important support for the stock is positioned at AUD 27.51, while key resistance is placed at AUD 33.68.
Daily Technical Chart – WBC
Individuals can evaluate the stock based on the support and resistance levels provided in the report in case of keen interest, taking into consideration the risk-reward scenario.
Considering the stock’s current price levels forming a top divergence during an uptrend, and momentum oscillator analysis, a “Watch” recommendation is given on the stock. The stock was analysed as per the closing price of AUD 31.08 per share as on 29 August 2024, up by 0.81%. Westpac Banking Corporation (ASX: WBC) was last covered in a report dated ’13 October 2022’.
Disclaimer: Kalkine’s Director Kunal Sawhney owns shares of Westpac Banking Corporation. Kalkine Pty Ltd has recommended Westpac Banking Corporation as general investment advice only (under AFSL 425376).
Note 1: Past performance is neither an Indicator nor a guarantee of future performance.
Note 2: Investment decision should be made depending on an individual’s appetite for upside potential, risks, and any previous holdings. This recommendation is purely based on technical analysis, and fundamental analysis has not been considered in this report.
Note 3: Related Risks: This report may be looked at from high-risk perspective and recommendations are provided are for a short duration. Recommendations provided in this report are solely based on technical parameters, and the fundamental performance of the stocks has not been considered in the decision-making process. Other factors which could impact the stock prices include market risks, regulatory risks, interest rates risks, currency risks, social and political instability risks etc.
The reference date for all price data, currency, technical indicators, support, and resistance levels is August 29, 2024. The reference data in this report has been partly sourced from REFINITIV.
Technical Indicators Defined:
Support: A level at which the stock prices tend to find support if they are falling, and a downtrend may take a pause backed by demand or buying interest. Support 1 refers to the nearby support level for the stock and if the price breaches the level, then Support 2 may act as the crucial support level for the stock.
Resistance: A level at which the stock prices tend to find resistance when they are rising, and an uptrend may take a pause due to profit booking or selling interest. Resistance 1 refers to the nearby resistance level for the stock and if the price surpasses the level, then Resistance 2 may act as the crucial resistance level for the stock.
Stop-loss: It is a level to protect further losses in case of unfavourable movement in the stock prices.
The Green colour line reflects the 21-period moving average. SMA helps to identify existing price trends. If the prices are trading above the 21-period, prices are currently in a bullish trend (Vice – Versa).
The Blue colour line reflects the 50-period moving average. SMA helps to identify existing price trends. If the prices are trading above the 50-period, prices are currently in a bullish trend (Vice – Versa).
The Orange/ Yellow colour line represents the Trendline.
The Purple colour line in the chart’s lower segment reflects the Relative Strength Index (14-Period), which indicates price momentum and signals momentum in trend. A reading of 70 or above suggests overbought status, while a reading of 30 or below suggests an oversold status.
 AU
AU

 Please wait processing your request...