Company Overview: Findi Limited (ASX: FND) is a digital payments and financial services provider in India. It is a non-bank ATM operator across cash and digital transaction ecosystems. The company processes and monitors over one billion transactions annually. This Report covers the Price Action, Technical Indicators Analysis along with the Support Levels, Resistance Levels, and Recommendations on these stocks.
Recent Updates:
- In FY24 ended 31 March 2024, the company reported a 22% year-on-year revenue increase to AUD 66.5 million, driven by the roll-out of its Central Bank of India contract. EBITDA rose by 63% year-on-year to AUD 27.4 million, and NPAT increased by 65.6% year-on-year to AUD 4 million. Operating cash flows surged by 471.7% to AUD 26.7 million.
- Key milestones in FY24 included a new 10-year agreement with State Bank of India (SBI), starting in mid-FY25, projected to generate up to AUD 620 million in revenue and AUD 280 million in EBITDA. Before this new contract begins, SBI extended the existing contract to September 2024, expected to contribute AUD 27 million in revenue and AUD 9 million in EBITDA over the nine months ending September 2024.
- In August 2024, the company announced an agreement with the Central Bank of India for operating banking correspondent locations, to be known as ‘BC Max’ Centres.
- For FY25, the company expects delivering revenue of AUD 80-90 million and EBITDA of AUD 30-35 million.
FND’s Technical Analysis:
On the daily chart, FND's stock price is developing a continuous symmetrical triangle pattern during an uptrend, indicating that the current uptrend in the stock remains intact. Additionally, the RSI (14-period) has surpassed its midpoint, providing further support for the mentioned recommendation. Prices are trading between its previous peak and trough, which may potentially function as resistance and support levels for the stock, respectively. Critical support for the stock is positioned at AUD 3.39, while key resistance is placed at AUD 4.50.
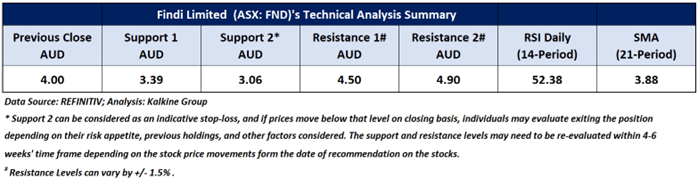

Daily Technical Chart – FND
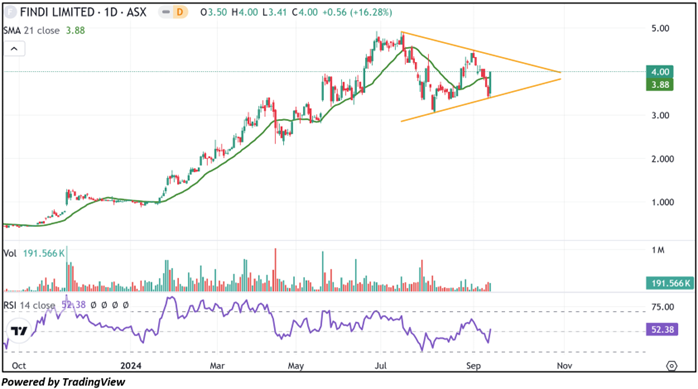
Considering the stock’s current price levels forming a symmetrical triangle pattern during an uptrend, and momentum oscillator analysis, a “Speculative Buy” recommendation is given on the stock. The stock was analysed as per the closing price of AUD 4.00 per share as on 12 September 2024, up by 16.28%.
Note 1: Past performance is neither an Indicator nor a guarantee of future performance.
Note 2: Investment decision should be made depending on an individual’s appetite for upside potential, risks, and any previous holdings. This recommendation is purely based on technical analysis, and fundamental analysis has not been considered in this report.
Note 3: Related Risks: This report may be looked at from high-risk perspective and recommendations are provided are for a short duration. Recommendations provided in this report are solely based on technical parameters, and the fundamental performance of the stocks has not been considered in the decision-making process. Other factors which could impact the stock prices include market risks, regulatory risks, interest rates risks, currency risks, social and political instability risks etc.
The reference date for all price data, currency, technical indicators, support, and resistance levels is September 12, 2024. The reference data in this report has been partly sourced from REFINITIV.
Technical Indicators Defined:
Support: A level at which the stock prices tend to find support if they are falling, and a downtrend may take a pause backed by demand or buying interest. Support 1 refers to the nearby support level for the stock and if the price breaches the level, then Support 2 may act as the crucial support level for the stock.
Resistance: A level at which the stock prices tend to find resistance when they are rising, and an uptrend may take a pause due to profit booking or selling interest. Resistance 1 refers to the nearby resistance level for the stock and if the price surpasses the level, then Resistance 2 may act as the crucial resistance level for the stock.
Stop-loss: It is a level to protect further losses in case of unfavourable movement in the stock prices.
The Green colour line reflects the 21-period moving average. SMA helps to identify existing price trends. If the prices are trading above the 21-period, prices are currently in a bullish trend (Vice – Versa).
The Blue colour line reflects the 50-period moving average. SMA helps to identify existing price trends. If the prices are trading above the 50-period, prices are currently in a bullish trend (Vice – Versa).
The Orange/ Yellow colour line represents the Trendline.
The Purple colour line in the chart’s lower segment reflects the Relative Strength Index (14-Period), which indicates price momentum and signals momentum in trend. A reading of 70 or above suggests overbought status, while a reading of 30 or below suggests an oversold status.
 AU
AU

 Please wait processing your request...