Company Overview: Whitehaven Coal Limited (ASX: WHC) is an Australia-based coal producer that develops and operates coal mines in New South Wales and Queensland. It has three primary segments: open-cut operations, underground operations, and coal trading & blending. This Report covers the Price Action, Technical Indicators Analysis along with the Support Levels, Resistance Levels, and Recommendations on this stock.
H1 FY26 Results (for the half-year ended 31 December 2025, released on 19 February 2026)
Operations — A positive half operationally. ROM coal production hit 20Mt (up from 19.4Mt in H1 FY25), and safety improved with TRIFR dropping to 2.9 from 4.6. Costs were also kept tight at AU$135/t vs AU$137/t previously.
Financials — The big drag was coal prices. Average price achieved fell 19% YoY to AU$189/t, pulling revenue down 28% YoY to AU$2.5bn and underlying EBITDA down 54% to AU$446mn. The company posted an underlying net loss of AU$19mn, though statutory NPAT was AU$69mn after AU$88mn in non-recurring gains from the BHP acquisition restructure. Net debt stood at AU$710mn (including US$500m reserved for the April 2026 BMA deferred payment).
Shareholder returns — A 4 cent fully franked interim dividend (AU$32mn) plus a matching AU$32mn buyback, totalling AU$64mn returned to shareholders.
Outlook — Management flagged early signs of a price recovery, particularly in metallurgical coal. FY26 production and sales guidance is unchanged, tracking to the upper half of the range. Costs tracking to the lower half. A AU$60–80mn annualised cost-out program is on track for delivery by end of FY26.
WHC’s Technical Analysis:
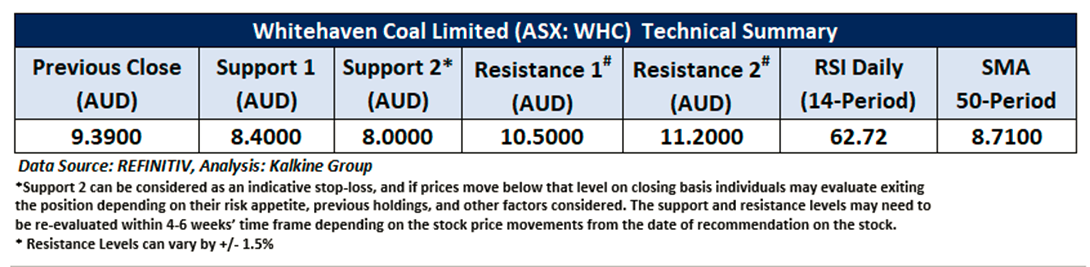
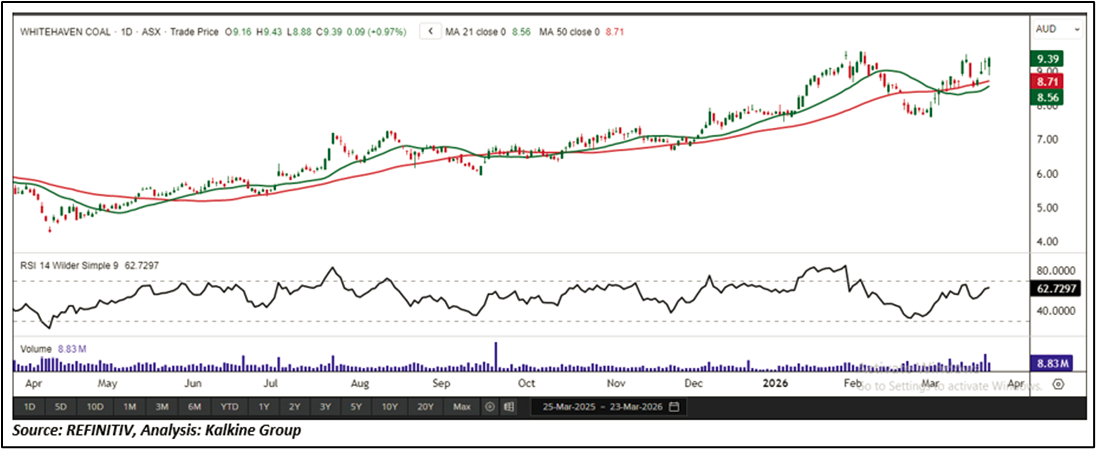
On the daily chart, WHC continues to trade below its key horizontal trendline. The 14-period Relative Strength Index (RSI), currently at 62.72, reflects a developing negative bias and suggests potential for downside if selling pressure intensifies. Additionally, the stock remains above its 21-period Simple Moving Average (SMA), which is acting as dynamic support. Immediate support is positioned at AUD 8.40, while key resistance is placed at AUD 10.50. A sustained move above this resistance level would be necessary to improve market sentiment and support any meaningful short-term recovery.
Daily Technical Chart – WHC
Individuals can evaluate the stock based on the support and resistance levels provided in the report in case of keen interest, taking into consideration the risk-reward scenario.
Considering the stock’s current price levels trading below rising trendline, and momentum oscillator analysis, a “Watch” recommendation is given on the stock. The stock was analysed as per closing price of AUD 9.39 per share as on 23 March 2026, up by 0.97%.
Note 1: Past performance is neither an Indicator nor a guarantee of future performance.
Note 2: Investment decision should be made depending on an individual’s appetite for upside potential, risks, and any previous holdings. This recommendation is purely based on technical analysis, and fundamental analysis has not been considered in this report.
Note 3: Related Risks: This report may be looked at from high-risk perspective and recommendations are provided are for a short duration. Recommendations provided in this report are solely based on technical parameters, and the fundamental performance of the stocks has not been considered in the decision-making process. Other factors which could impact the stock prices include market risks, regulatory risks, interest rates risks, currency risks, social and political instability risks etc.
The reference date for all price data, currency, technical indicators, support, and resistance levels is March 23, 2026. The reference data in this report has been partly sourced from REFINITIV.
Technical Indicators Defined:
Support: A level at which the stock prices tend to find support if they are falling, and a downtrend may take a pause backed by demand or buying interest. Support 1 refers to the nearby support level for the stock and if the price breaches the level, then Support 2 may act as the crucial support level for the stock.
Resistance: A level at which the stock prices tend to find resistance when they are rising, and an uptrend may take a pause due to profit booking or selling interest. Resistance 1 refers to the nearby resistance level for the stock and if the price surpasses the level, then Resistance 2 may act as the crucial resistance level for the stock.
Stop-loss: It is a level to protect further losses in case of unfavourable movement in the stock prices.
The Green colour line reflects the 21-period moving average. SMA helps to identify existing price trends. If the prices are trading above the 21-period, prices are currently in a bullish trend (Vice – Versa).
The Blue colour line reflects the 50-period moving average. SMA helps to identify existing price trends. If the prices are trading above the 50-period, prices are currently in a bullish trend (Vice – Versa).
The Orange/ Yellow colour line represents the Trendline.
The Purple colour line in the chart’s lower segment reflects the Relative Strength Index (14-Period), which indicates price momentum and signals momentum in trend. A reading of 70 or above suggests overbought status, while a reading of 30 or below suggests an oversold status.

 CA
 NZ
 UK
 US
 IND

 AU

 Please wait processing your request...