Company Overview: Boss Energy Ltd (ASX: BOE) is engaged into uranium mining productions and operates world-class in-situ recovery (ISR) projects across Australia and the United States. The company’s flagship asset is the 100%-owned Honeymoon Uranium Project in South Australia, which employs low-cost, environmentally responsible ISR mining technology to supply uranium for the global nuclear energy market. This Report covers the Price Action, Technical Indicators Analysis along with the Support Levels, Resistance Levels, and Recommendations on this stock.
Recent News:
December Quarter Results (2QFY26): For the December quarter of FY26, the company reported sales and loan repayments of AUD 39.3mn, down from AUD 57.1mn in Q1 FY26. The average realised price remained broadly stable at US$74.0/lb (A$112.2/lb) compared with US$74.7/lb (A$114.3/lb) in the prior quarter. Sales volumes declined to 350,000 lbs from 400,000 lbs in Q1, with no loan repayment volumes recorded in Q2 versus 100,000 lbs in Q1. Inventory on hand increased to around 1.62m lbs, up from approximately 1.44m lbs at the end of the September quarter, reflecting lower sales volumes during the period.
Outlook: BOE remains on track to meet its FY26 guidance. Continued operational improvements at the Honeymoon operation have supported a reduction in operating cost guidance. The company maintains a healthy balance sheet, with AUD 208 million in cash and liquid assets, while its deliberately under-contracted sales position provides flexibility to capture upside from a tightening uranium market. Progressing and delivering the New Feasibility Study on time remains a key strategic priority, with the potential to enhance returns across Honeymoon, Goulds Dam and Jasons Deposit compared with the current wellfield design.
BOE’s Technical Analysis:
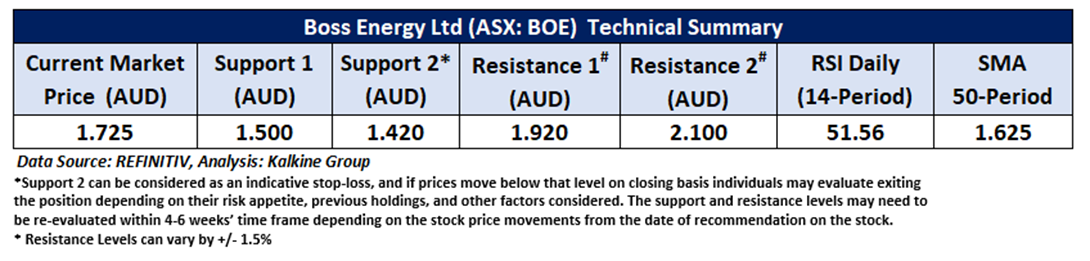
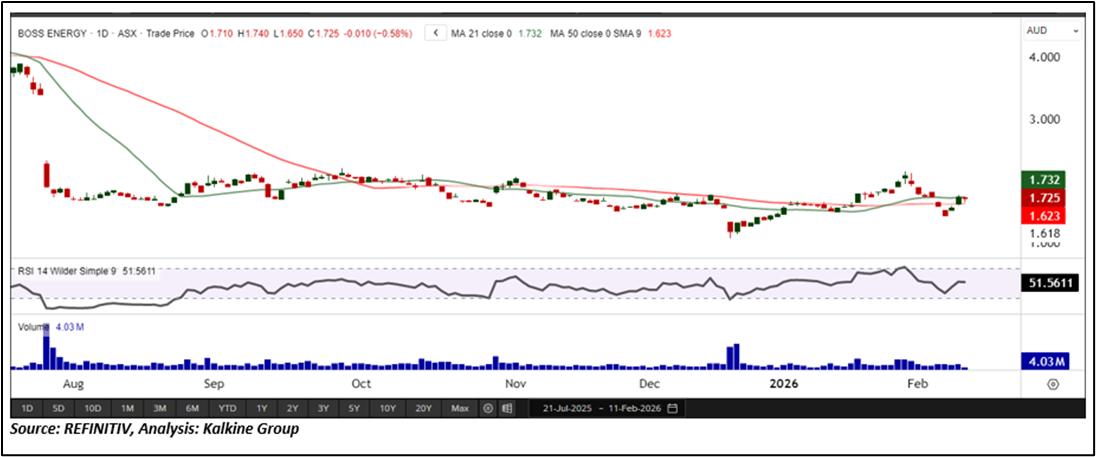
BOE continues to trade above a key horizontal support zone on the daily chart, indicating price stability and sustained buying interest. The 14-period RSI at 51.56 reflects a mild bullish bias, while price action remains above the 50-period SMA, which is providing dynamic support and reinforcing the prevailing uptrend. Key support is located near AUD 1.50, with resistance around AUD 1.92. A decisive breakout above resistance could signal further upside potential, whereas a break below support may lead to consolidation or a short-term pullback.

Daily Technical Chart – BOE
Considering the stock’s current price levels are trading above the horizontal trendline support, and momentum oscillator analysis, a “Speculative Buy” recommendation is given on the stock. The stock was analysed as per the current market price of AUD 1.725 per share as on 11 February 2026 at 3:00 PM AEDT, down by 0.58%.
Note 1: Past performance is neither an Indicator nor a guarantee of future performance.
Note 2: Investment decision should be made depending on an individual’s appetite for upside potential, risks, and any previous holdings. This recommendation is purely based on technical analysis, and fundamental analysis has not been considered in this report.
Note 3: Related Risks: This report may be looked at from high-risk perspective and recommendations are provided are for a short duration. Recommendations provided in this report are solely based on technical parameters, and the fundamental performance of the stocks has not been considered in the decision-making process. Other factors which could impact the stock prices include market risks, regulatory risks, interest rates risks, currency risks, social and political instability risks etc.
The reference date for all price data, currency, technical indicators, support, and resistance levels is February 11, 2026. The reference data in this report has been partly sourced from REFINITIV.
Technical Indicators Defined:
Support: A level at which the stock prices tend to find support if they are falling, and a downtrend may take a pause backed by demand or buying interest. Support 1 refers to the nearby support level for the stock and if the price breaches the level, then Support 2 may act as the crucial support level for the stock.
Resistance: A level at which the stock prices tend to find resistance when they are rising, and an uptrend may take a pause due to profit booking or selling interest. Resistance 1 refers to the nearby resistance level for the stock and if the price surpasses the level, then Resistance 2 may act as the crucial resistance level for the stock.
Key Risks: Technical indicators are backward-looking and may generate false or lagged signals, particularly during volatile or changing market conditions. Price trends may also be disrupted by fundamental, macroeconomic, or company-specific developments not captured in charts.
Stop-loss: It is a level to protect further losses in case of unfavourable movement in the stock prices.
The Green colour line reflects the 21-period moving average. SMA helps to identify existing price trends. If the prices are trading above the 21-period, prices are currently in a bullish trend (Vice – Versa).
The Blue colour line reflects the 50-period moving average. SMA helps to identify existing price trends. If the prices are trading above the 50-period, prices are currently in a bullish trend (Vice – Versa).
The Orange/ Yellow colour line represents the Trendline.
The Purple colour line in the chart’s lower segment reflects the Relative Strength Index (14-Period), which indicates price momentum and signals momentum in trend. A reading of 70 or above suggests overbought status, while a reading of 30 or below suggests an oversold status.

 CA
 NZ
 UK
 US
 IND

 AU

 Please wait processing your request...