Company Overview: Ainsworth Game Technology Limited (ASX: AGI) is an Australia-based company engaged in the designing, developing, manufacturing, selling and servicing of gaming machines and other related equipment and services. This Report covers the Price Action, Technical Indicators Analysis along with the Support Levels, Resistance Levels, and Recommendations on this stock.
Recent Update: The company has signed a Scheme Implementation Deed (SID) with Novomatic AG ("Novomatic") to acquire all AGI shares not currently owned by Novomatic, which holds a 52.9% stake. Under the scheme, AGI shareholders will receive $1.00 per share in cash, minus any declared dividend. This offer values AGI at A$336.8 million, with an enterprise value of A$336.5 million, reflecting a ~7.0x EV/FY24A EBITDA multiple. The cash offer represents a 35% premium to AGI’s closing price of $0.74 on 24 April 2025 and a 27% premium to its 1-month VWAP. The Scheme is subject to customary approvals, including shareholder approval at the Scheme meeting.
Financial Performance: The company reported a normalised Profit Before Tax (PBT) of AUD 23.2 million for CY24, excluding currency fluctuations and one-off items, a decrease from AUD 41.5 million in the previous period ending 31 December 2023. The company’s product performance and global market development have ensured sustainable profitability, with expectations of increased revenue across key regions in CY25. The company’s revenue stood at AUD 264.1 million during the period, a 7% decrease on a year over year basis, while underlying EBITDA stood at AUD 48.2 million, down from AUD 59.0 million reported in the year-ago period.
AGI’s Technical Analysis:
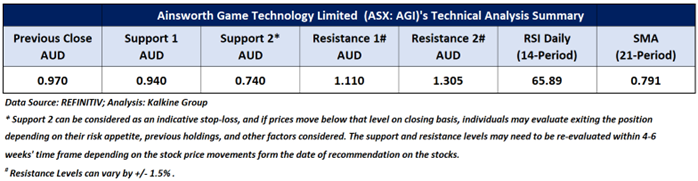
On the daily chart, following a trading range, AGI's stock price broke above its previous peak coupled with a breakaway gap, signalling a positive trend. Additionally, the RSI (14-period) is heading north from its midpoint, providing further support for the mentioned recommendation. Prices are trading above both its previous peak, which may potentially function as support level for the stock; in contrast, the low in March 2024 might act as a resistance level. Crucial support for the stock is positioned at AUD 0.940, while key resistance is placed at AUD 1.110.

Daily Technical Chart – AGI
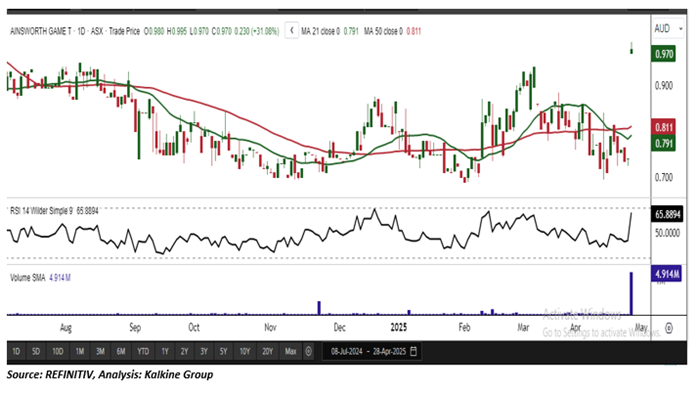
Considering the stock’s current price levels breaking above its previous peak coupled with a breakaway gap, and momentum oscillator analysis, a “Speculative Buy” recommendation is given on the stock. The stock was analysed as per the closing price of AUD 0.970 per share as on 28 April 2025, up by 31.08%. Ainsworth Game Technology Limited (ASX: AGI) was last covered in a report dated ’19 August 2022’.
Note 1: Past performance is neither an Indicator nor a guarantee of future performance.
Note 2: Investment decision should be made depending on an individual’s appetite for upside potential, risks, and any previous holdings. This recommendation is purely based on technical analysis, and fundamental analysis has not been considered in this report.
Note 3: Related Risks: This report may be looked at from high-risk perspective and recommendations are provided are for a short duration. Recommendations provided in this report are solely based on technical parameters, and the fundamental performance of the stocks has not been considered in the decision-making process. Other factors which could impact the stock prices include market risks, regulatory risks, interest rates risks, currency risks, social and political instability risks etc.
The reference date for all price data, currency, technical indicators, support, and resistance levels is April 28, 2025. The reference data in this report has been partly sourced from REFINITIV.
Technical Indicators Defined:
Support: A level at which the stock prices tend to find support if they are falling, and a downtrend may take a pause backed by demand or buying interest. Support 1 refers to the nearby support level for the stock and if the price breaches the level, then Support 2 may act as the crucial support level for the stock.
Resistance: A level at which the stock prices tend to find resistance when they are rising, and an uptrend may take a pause due to profit booking or selling interest. Resistance 1 refers to the nearby resistance level for the stock and if the price surpasses the level, then Resistance 2 may act as the crucial resistance level for the stock.
Stop-loss: It is a level to protect further losses in case of unfavourable movement in the stock prices.
The Green colour line reflects the 21-period moving average. SMA helps to identify existing price trends. If the prices are trading above the 21-period, prices are currently in a bullish trend (Vice – Versa).
The Blue colour line reflects the 50-period moving average. SMA helps to identify existing price trends. If the prices are trading above the 50-period, prices are currently in a bullish trend (Vice – Versa).
The Orange/ Yellow colour line represents the Trendline.
The Purple colour line in the chart’s lower segment reflects the Relative Strength Index (14-Period), which indicates price momentum and signals momentum in trend. A reading of 70 or above suggests overbought status, while a reading of 30 or below suggests an oversold status.
 AU
AU

 Please wait processing your request...