Company Overview: Electro Optic Systems Holdings Limited (ASX: EOS) is an Australian-based technology company that designs, manufactures, and sells advanced defense and space systems. Headquartered in Symonston, ACT, EOS operates through two primary segments: Defence Systems and Space Systems. Its core offerings include Remote Weapon Systems (RWS), counter-drone and directed energy solutions, and space domain awareness technologies such as satellite tracking and telescope systems. This Report covers the Price Action, Technical Indicators Analysis along with the Support Levels, Resistance Levels, and Recommendations on this stock.
Recent Updates:
In FY2024, EOS reported revenue of AU$176.6 million, marking a 9% year-on-year increase. However, the company remains loss-making, posting a net loss of AU$34.2 million and an EBIT loss of AU$27 million. Gross margins stood at approximately 48%, and earnings per share improved from a loss of AU$0.20 to a narrower loss of AU$0.018 per share. The company’s cash balance as of December 2024 was AU$41.1 million against gross debt of AU$47.9 million, resulting in a manageable net debt position of around AU$7 million.
Recently the company has received a US$5.3 million counter-drone system order. EOS is also divesting its EM Solutions subsidiary for US$158.6 million. This sale significantly improved EOS’s financial flexibility, allowing it to repay AU$61.1 million in borrowings and increase its cash position to AU$103.1 million.
Overall, EOS is making strategic moves to strengthen its balance sheet and focus on high-growth defense and space opportunities. While it still faces the hurdle of achieving profitability, its recent contract wins, and asset sales have bolstered its outlook. Investors should watch for continued contract momentum and cash conversion progress, with the next interim results due August 26, 2025.
EOS’ Technical Analysis:
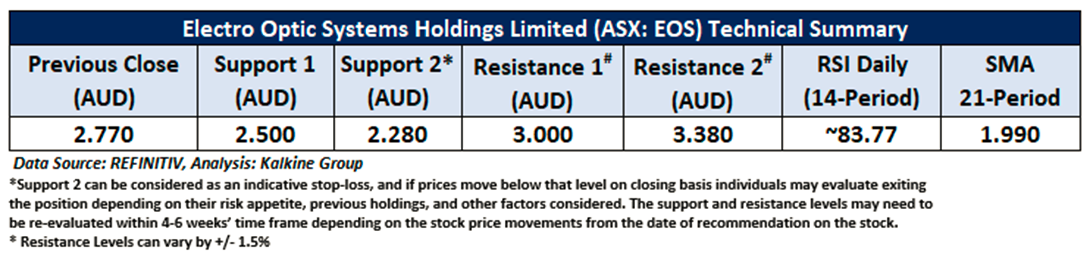
On the daily chart, EOS' stock price is undergoing an uptrend characterized by higher highs and higher lows, indicating a positive bias. Additionally, the RSI (14-period) is heading north from its midpoint, providing further support for the mentioned recommendation. Prices are trading above both the 21-period and 50-day SMAs, which may potentially function as dynamic support levels for the stock; in contrast, the stock’s next round level might act as a sentimental resistance. Crucial support for the stock is positioned at AUD 2.50, while key resistance is placed at AUD 3.00.

Daily Technical Chart – EOS
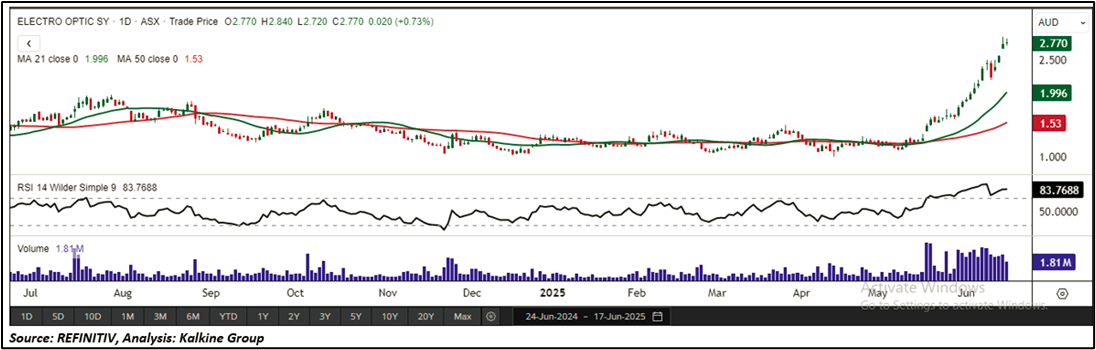
Considering the stock’s current price levels forming higher peaks and higher troughs, and momentum oscillator analysis, a “Speculative Buy” recommendation is given on the stock. The stock was analysed as per the closing price of AUD 2.77 per share as on 17 June 2025, up by 0.73%. Electro Optic Systems Holdings Limited (ASX: EOS) was last covered in a report dated ’14 April 2025’.
Note 1: Past performance is neither an Indicator nor a guarantee of future performance.
Note 2: Investment decision should be made depending on an individual’s appetite for upside potential, risks, and any previous holdings. This recommendation is purely based on technical analysis, and fundamental analysis has not been considered in this report.
Note 3: Related Risks: This report may be looked at from high-risk perspective and recommendations are provided are for a short duration. Recommendations provided in this report are solely based on technical parameters, and the fundamental performance of the stocks has not been considered in the decision-making process. Other factors which could impact the stock prices include market risks, regulatory risks, interest rates risks, currency risks, social and political instability risks etc.
The reference date for all price data, currency, technical indicators, support, and resistance levels is June 17, 2025. The reference data in this report has been partly sourced from REFINITIV.
Technical Indicators Defined:
Support: A level at which the stock prices tend to find support if they are falling, and a downtrend may take a pause backed by demand or buying interest. Support 1 refers to the nearby support level for the stock and if the price breaches the level, then Support 2 may act as the crucial support level for the stock.
Resistance: A level at which the stock prices tend to find resistance when they are rising, and an uptrend may take a pause due to profit booking or selling interest. Resistance 1 refers to the nearby resistance level for the stock and if the price surpasses the level, then Resistance 2 may act as the crucial resistance level for the stock.
Stop-loss: It is a level to protect further losses in case of unfavourable movement in the stock prices.
The Green colour line reflects the 21-period moving average. SMA helps to identify existing price trends. If the prices are trading above the 21-period, prices are currently in a bullish trend (Vice – Versa).
The Blue colour line reflects the 50-period moving average. SMA helps to identify existing price trends. If the prices are trading above the 50-period, prices are currently in a bullish trend (Vice – Versa).
The Orange/ Yellow colour line represents the Trendline.
The Purple colour line in the chart’s lower segment reflects the Relative Strength Index (14-Period), which indicates price momentum and signals momentum in trend. A reading of 70 or above suggests overbought status, while a reading of 30 or below suggests an oversold status.
 AU
AU

 Please wait processing your request...