Company Overview: Alkane Resources Limited (ASX: ALK) is an Australian gold and critical minerals producer focused on its flagship Tomingley Gold Operations in New South Wales. The company also has exploration projects and is advancing its position in rare earths and antimony markets. Alkane’s business model combines steady gold production with growth through exploration and strategic acquisitions. This Report covers the Price Action, Technical Indicators Analysis along with the Support Levels, Resistance Levels, and Recommendations on this stock.
Quarterly Update (for the quarter ended 31 March 2025, released on 29 April 2025)
In the March 2025 quarter, Alkane produced 17,657 ounces of gold and generated revenue of AU$63.4 million at an average realized price of A$3,839 per ounce. The site operating cash costs were AU$2,178 per ounce with an all-in sustaining cost (AISC) of AU$2,770 per ounce, resulting in an operating cash flow of AU$29 million for the quarter. Alkane’s cash, bullion, and listed investments increased to AU$58.6 million, up AU$16.2 million from the previous quarter, while the company continued to reduce debt and hedge obligations. The FY2025 production guidance for Tomingley remains between 70,000 and 80,000 ounces, though management expects output toward the lower end of this range.
Merger Update
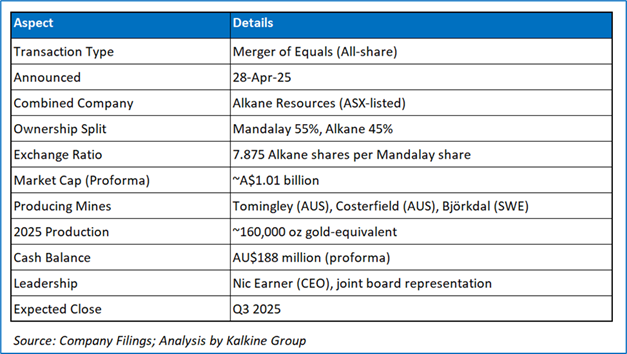
A major development post-quarter was the announcement of a “merger of equals” with Mandalay Resources Corporation (TSX: MND), creating a larger, diversified gold and antimony producer with a proforma cash balance of approximately AU$188 million. The combined company will operate three producing mines-Tomingley (Australia), Costerfield (Australia), and Björkdal (Sweden)-with projected gold equivalent production of around 160,000 ounces in 2025, rising to over 180,000 ounces in 2026. This merger can enhance Alkane’s scale, financial strength, and exposure to the strategic antimony market, positioning the new entity for stronger cash flow generation, improved liquidity, and greater growth flexibility. The transaction, expected to complete in Q3 2025, is anticipated to drive a valuation re-rate and can create shareholder value.
Key Details of Alkane Resources and Mandalay Resources Merger
ALK’s Technical Analysis:
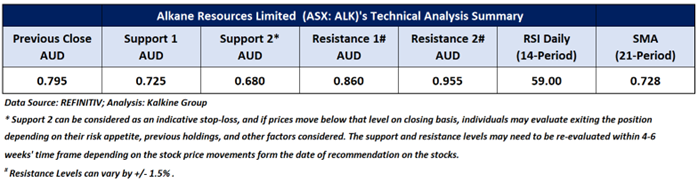
On the daily chart, ALK's stock price is undergoing an uptrend characterized by higher highs and higher lows, indicating a positive bias. Additionally, the RSI (14-period) is trading above its midpoint, providing further support for the mentioned recommendation. Prices are trading between its previous peak and trough, which may potentially function as resistance and support levels for the stock, respectively. Crucial support for the stock is positioned at AUD 0.725, while key resistance is placed at AUD 0.86.

Daily Technical Chart – ALK
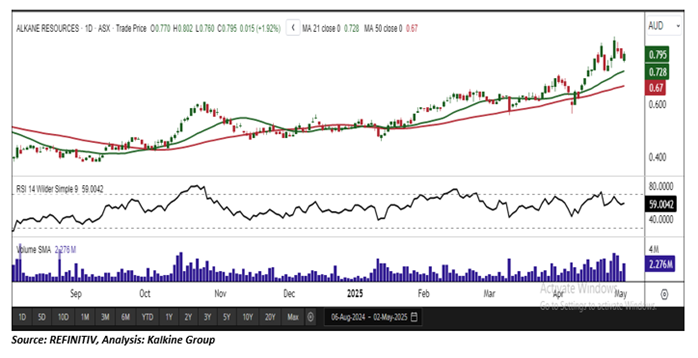
Considering the stock’s current price levels forming higher peaks and higher troughs, and momentum oscillator analysis, a “Speculative Buy” recommendation is given on the stock. The stock was analysed as per the closing price of AUD 0.795 per share as on 02 May 2025, up by 1.92%. Alkane Resources Limited (ASX: ALK) was last covered in a report dated ’17 October 2024’.
Note 1: Past performance is neither an Indicator nor a guarantee of future performance.
Note 2: Investment decision should be made depending on an individual’s appetite for upside potential, risks, and any previous holdings. This recommendation is purely based on technical analysis, and fundamental analysis has not been considered in this report.
Note 3: Related Risks: This report may be looked at from high-risk perspective and recommendations are provided are for a short duration. Recommendations provided in this report are solely based on technical parameters, and the fundamental performance of the stocks has not been considered in the decision-making process. Other factors which could impact the stock prices include market risks, regulatory risks, interest rates risks, currency risks, social and political instability risks etc.
The reference date for all price data, currency, technical indicators, support, and resistance levels is May 02, 2025. The reference data in this report has been partly sourced from REFINITIV.
Technical Indicators Defined:
Support: A level at which the stock prices tend to find support if they are falling, and a downtrend may take a pause backed by demand or buying interest. Support 1 refers to the nearby support level for the stock and if the price breaches the level, then Support 2 may act as the crucial support level for the stock.
Resistance: A level at which the stock prices tend to find resistance when they are rising, and an uptrend may take a pause due to profit booking or selling interest. Resistance 1 refers to the nearby resistance level for the stock and if the price surpasses the level, then Resistance 2 may act as the crucial resistance level for the stock.
Stop-loss: It is a level to protect further losses in case of unfavourable movement in the stock prices.
The Green colour line reflects the 21-period moving average. SMA helps to identify existing price trends. If the prices are trading above the 21-period, prices are currently in a bullish trend (Vice – Versa).
The Blue colour line reflects the 50-period moving average. SMA helps to identify existing price trends. If the prices are trading above the 50-period, prices are currently in a bullish trend (Vice – Versa).
The Orange/ Yellow colour line represents the Trendline.
The Purple colour line in the chart’s lower segment reflects the Relative Strength Index (14-Period), which indicates price momentum and signals momentum in trend. A reading of 70 or above suggests overbought status, while a reading of 30 or below suggests an oversold status.
 AU
AU
 Please wait processing your request...