Company Overview: Karoon Energy Ltd. (ASX: KAR) is an Australian oil and gas exploration and production company with operations in United States of America, Brazil, and Australia. This Report covers the Price Action, Technical Indicators Analysis along with the Support Levels, Resistance Levels, and Recommendations on this stock.
Recent Updates:
In May 2024, KAR announced the appointment of Mr. Marco Brummelhuis as the Executive Vice President and Country Manager of Karoon Brazil, effective from 1st July 2024.
During Q3FY24 for the period ended 31 March 2024, KAR reported its quarterly production of 3.11 MMboe on NWI basis, which depicted an increase of 18% from the previous quarter. Also, the quarterly revenue of KAR declined by 6% from the previous quarter to USD 196.6mn. Total capital expenditure for march quarter was USD 21.3mn, primarily due to an increase in drilling and exploration activities at Who Dat exploration well. As on 31st March 2024, the company’s cash balance stood at USD 119.5mn.
For CY24, Brazil production is expected to be in the range of 7.5 to 9.0 million barrels (MMbbl). Total production for CY24 including the Who Dat assets, is anticipated to be in a range of 10.5 to 12.5 million barrels of oil equivalent (MMboe). Unit production costs for the 12 months are expected to be in the ambit of USD 10.5 to USD 15.0 per boe. Total capital expenditure for CY24 is expected to be in the range of USD 132 to USD 164 per boe.
KAR’s Technical Analysis:
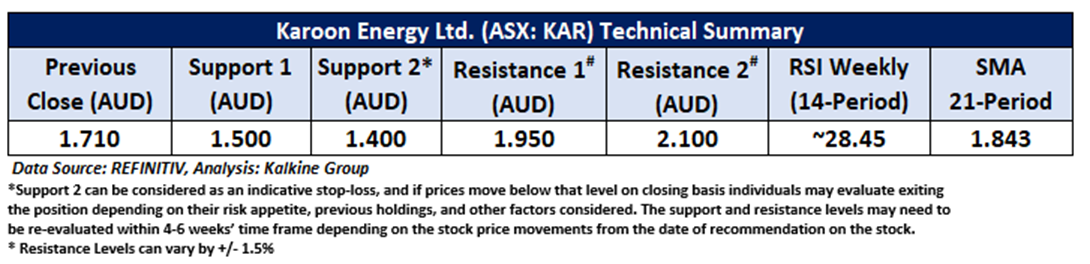
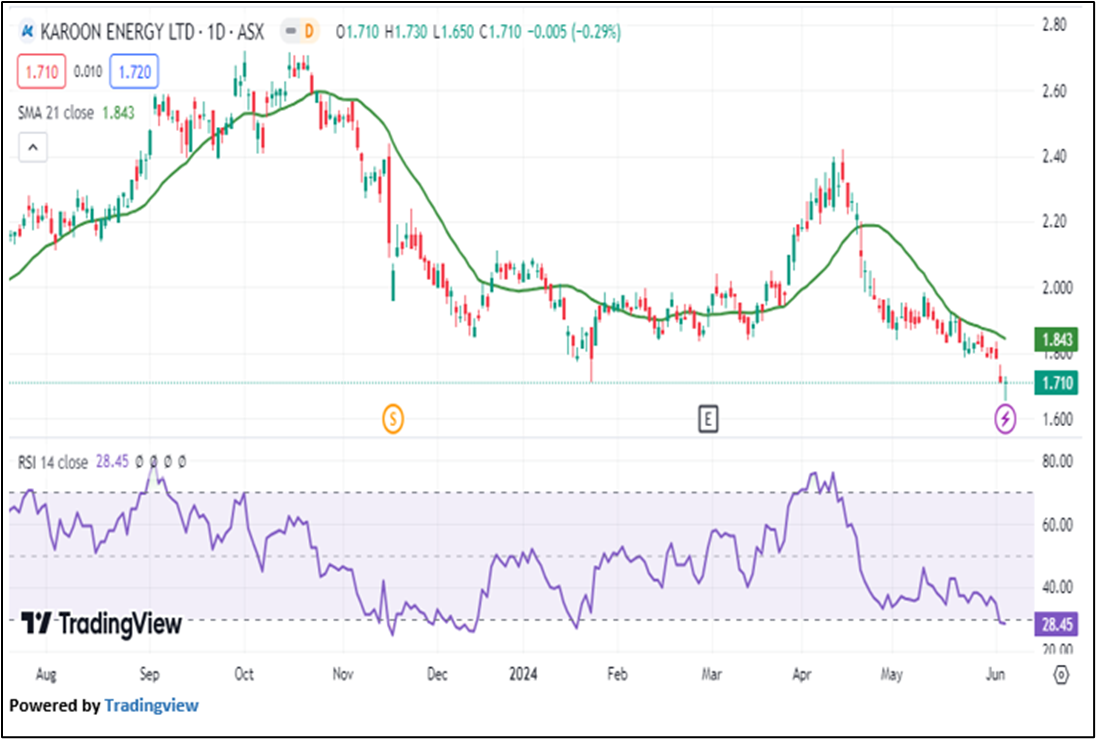
On the daily chart, KAR prices are trading above the horizontal trendline support zone. Moreover, the momentum oscillator RSI (14-period) is showing a reading of ~28.45 level. However, the prices are trading below the trend-following indicator 21-period SMA, which may act as a resistance level. An important support level for the stock is placed at AUD 1.50, while the key resistance level is placed at AUD 1.95.
Daily Technical Chart – KAR
Individuals can evaluate the stock based on the support and resistance levels provided in the report in case of keen interest, taking into consideration the risk-reward scenario.
Considering the stock’s current price levels forming a trading range, and momentum oscillator analysis, a “Speculative Buy” recommendation is given on the stock. The stock was analysed as per the closing price of AUD 1.710 per share as on 05 June 2024, down by 0.29%. Karoon Energy Ltd. (ASX: KAR) was last covered in a report dated ’16 May 2024’.
Note 1: Past performance is neither an Indicator nor a guarantee of future performance.
Note 2: Investment decision should be made depending on an individual’s appetite for upside potential, risks, and any previous holdings. This recommendation is purely based on technical analysis, and fundamental analysis has not been considered in this report.
Note 3: Related Risks: This report may be looked at from high-risk perspective and recommendations are provided are for a short duration. Recommendations provided in this report are solely based on technical parameters, and the fundamental performance of the stocks has not been considered in the decision-making process. Other factors which could impact the stock prices include market risks, regulatory risks, interest rates risks, currency risks, social and political instability risks etc.
The reference date for all price data, currency, technical indicators, support, and resistance levels is June 05, 2024. The reference data in this report has been partly sourced from REFINITIV.
Technical Indicators Defined:
Support: A level at which the stock prices tend to find support if they are falling, and a downtrend may take a pause backed by demand or buying interest. Support 1 refers to the nearby support level for the stock and if the price breaches the level, then Support 2 may act as the crucial support level for the stock.
Resistance: A level at which the stock prices tend to find resistance when they are rising, and an uptrend may take a pause due to profit booking or selling interest. Resistance 1 refers to the nearby resistance level for the stock and if the price surpasses the level, then Resistance 2 may act as the crucial resistance level for the stock.
Stop-loss: It is a level to protect further losses in case of unfavourable movement in the stock prices.
The Green colour line reflects the 21-period moving average. SMA helps to identify existing price trends. If the prices are trading above the 21-period, prices are currently in a bullish trend (Vice – Versa).
The Blue colour line reflects the 50-period moving average. SMA helps to identify existing price trends. If the prices are trading above the 50-period, prices are currently in a bullish trend (Vice – Versa).
The Orange/ Yellow colour line represents the Trendline.
The Purple colour line in the chart’s lower segment reflects the Relative Strength Index (14-Period), which indicates price momentum and signals momentum in trend. A reading of 70 or above suggests overbought status, while a reading of 30 or below suggests an oversold status.
 AU
AU

 Please wait processing your request...