Company Overview: Sayona Mining Limited (ASX: SYA) engages in mineral identification, acquisition, exploration, and development in Australia and Canada, its the North American Lithium project comprises 19 contiguous claims covering an area of 582.31 hectares located in Quebec, Canada. Electro Optic Systems Holdings Limited (ASX: EOS) operates in Defence Systems and Space Systems segments, which engages in the development, manufacture, and sale of telescopes and dome enclosures, laser satellite tracking systems, electro-optic fire control systems, and microwave satellite dishes and receivers. Way 2 Vat Limited (ASX: W2V) develops automatic value added tax (VAT) reclaims and compliance applications for enterprises worldwide, which owns and operates VAT/goods and services tax (GST) reclaim platform. Enova Mining Limited (ASX: ENV) engages in the exploration for rare earth elements (REE) in Australia, primarily focusing on the Charley Creek REE project located in the Northern Territory. This Report covers the Price Action, Technical Indicators Analysis along with the Support Levels, Resistance Levels, and Recommendations on these stocks.
SYA’s Technical Analysis:
On the daily chart, SYA's stock price is forming a trading range characterized by lower highs and higher lows, suggesting that the sideways period in the stock might continue to persist in the near future. Additionally, the RSI (14-period) is fluctuating between 40 and 80, providing further support for the mentioned recommendation. Prices are trading below both the 21-period and 50-day SMAs, which may potentially function as dynamic resistance levels for the stock; in contrast, the stock’s most recent low might act as a support level. Crucial support for the stock is positioned at AUD 0.028, while key resistance is placed at AUD 0.041.
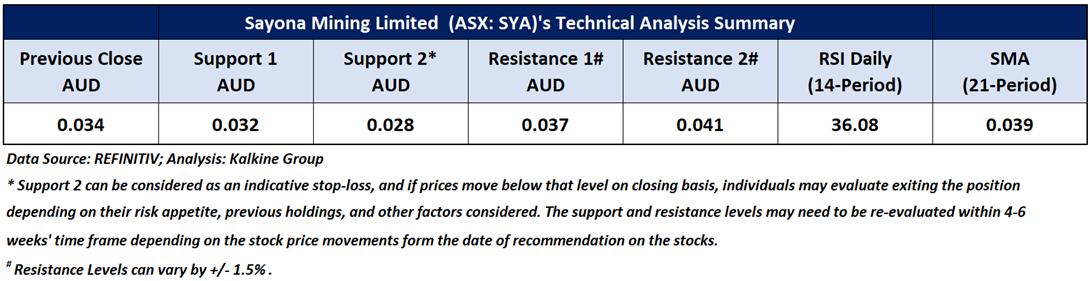
Daily Technical Chart – SYA
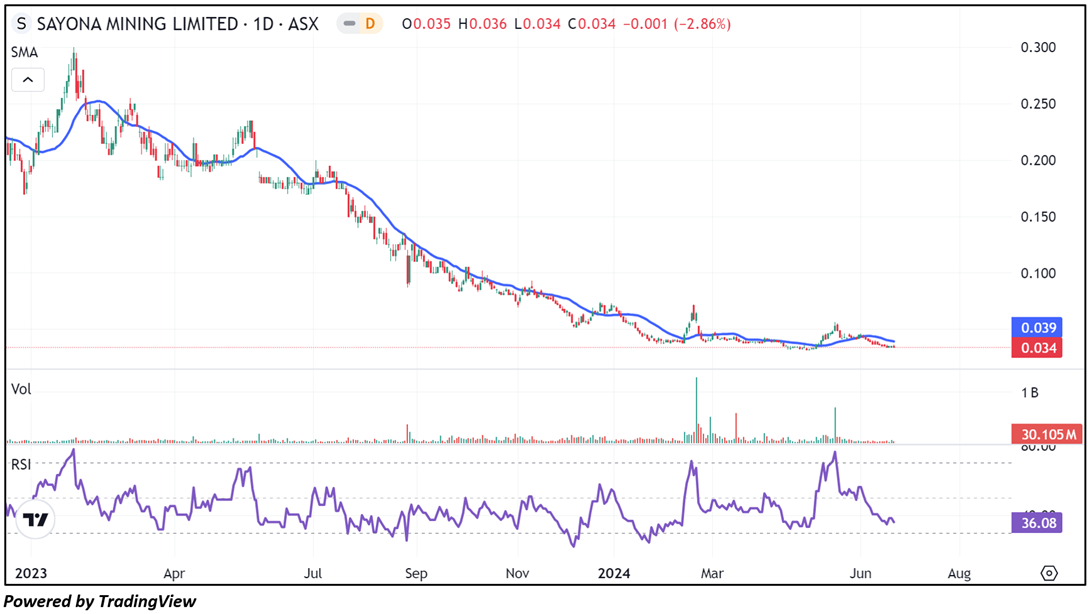
Individuals can evaluate the stock based on the support and resistance levels provided in the report in case of keen interest, taking into consideration the risk-reward scenario.
Considering the stock’s current price levels forming a trading range, and momentum oscillator analysis, a “Watch” recommendation is given on the stock. The stock was analysed as per the closing price of AUD 0.034 per share as on 24 June 2024, down by 2.86%. Sayona Mining Limited (ASX: SYA) was last covered in a report dated ’14 February 2024.’.
EOS’s Technical Analysis:
While experience a correction during an uptrend, EOS's stock price developed a descending wedge pattern whose was broken through two sessions ago, signalling a positive trend. Since then, the stock has been creating higher peaks and higher troughs, indicating that the short-term uptrend remains intact. Moreover, the RSI (14-period) is heading north from the midpoint, providing further support for the mentioned recommendation. Prices are trading above the 21-period SMA, which may potentially function as dynamic support level for the stock; in contrast, the stock’s previous peak might act as a resistance level. Important support for the stock is positioned at AUD 1.32, while key resistance is placed at AUD 1.66.
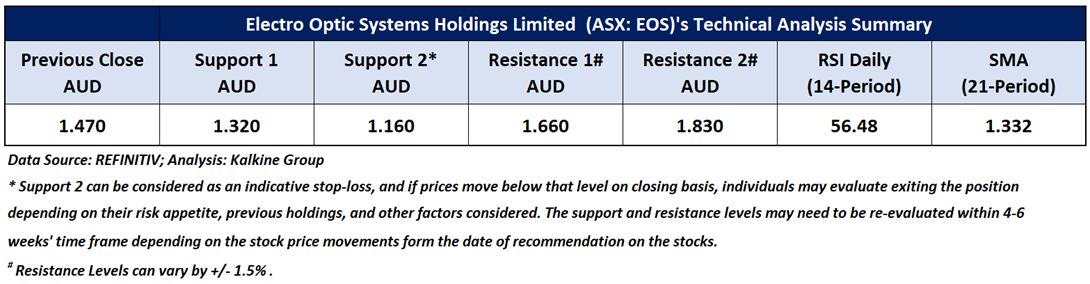

Daily Technical Chart – EOS
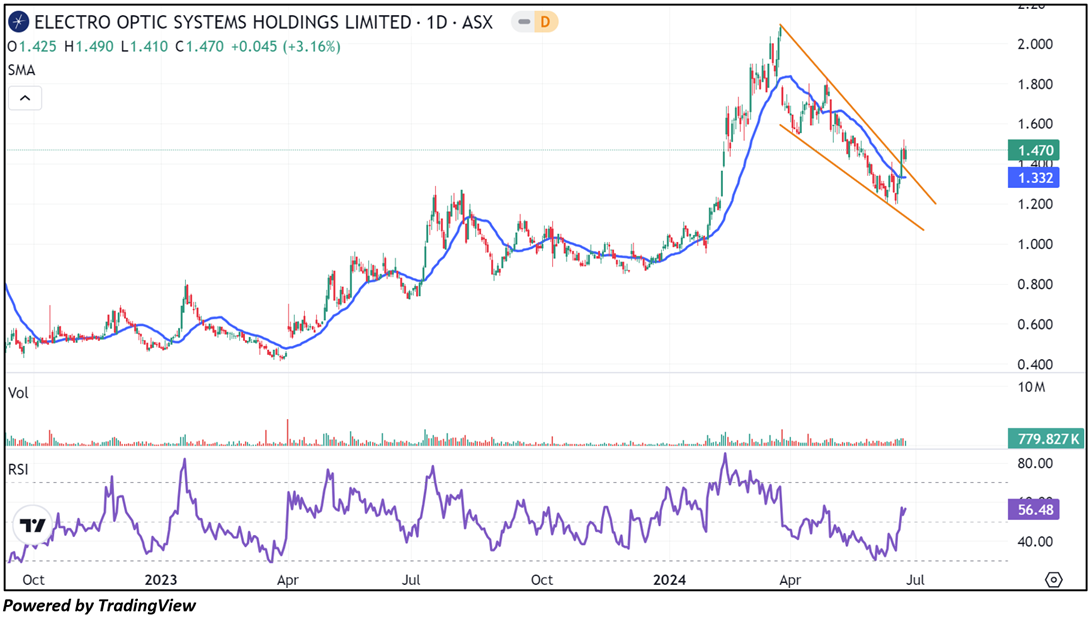
Considering the stock’s current price levels breaking above a descending wedge pattern, and momentum oscillator analysis, a “Speculative Buy” recommendation is given on the stock. The stock was analysed as per the closing price of AUD 1.47 per share as on 24 June 2024, up by 3.16%. Electro Optic Systems Holdings Limited (ASX: EOS) was last covered in a report dated ’26 April 2024’.
W2V’s Technical Analysis:
While undergoing a downtrend, W2V's stock price is testing a significant support established since March 2023, anticipating for a potential minor rally. Additionally, the RSI (14-period) is trading near the oversold region, adding more evidence to the previous observation. Prices are trading below both the 21-period and 50-day SMAs, which may potentially function as dynamic resistance levels for the stock; in contrast, the stock’s previous low might act as a support level. Important support for the stock is positioned at AUD 0.006, while key resistance is placed at AUD 0.010.
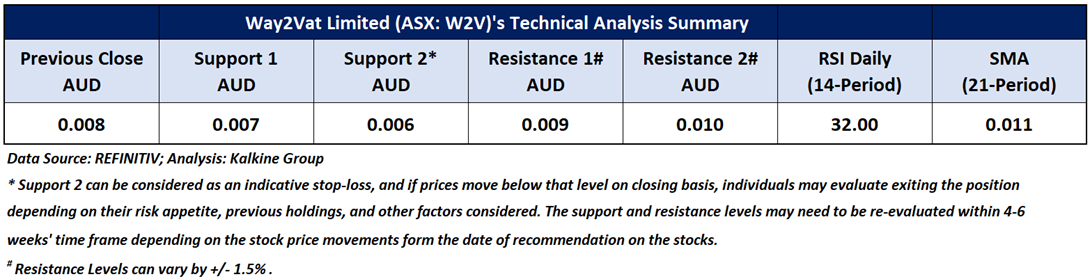
Daily Technical Chart – W2V
Individuals can evaluate the stock based on the support and resistance levels provided in the report in case of keen interest, taking into consideration the risk-reward scenario.
Considering the stock’s current price levels testing its significant support, and momentum oscillator analysis, a “Watch” recommendation is given on the stock. The stock was analysed as per the closing price of AUD 0.008 per share as on 24 June 2024, down by 20.00%. Way 2 Vat Limited (ASX: W2V) was last covered in a report dated ’21 February 2024’.
ENV’s Technical Analysis:
On the daily chart, ENV's stock price is undergoing a downtrend characterized by lower lows and lower highs, indicating a negative bias. Additionally, the RSI (14-period) is heading southward from the midpoint, providing further support to the previous analysis. Prices are trading below both the 21-period and 50-day SMAs, which may potentially function as dynamic support levels for the stock; in contrast, the stock’s nearest round level might act as a support level. Important support for the stock is positioned at AUD 0.01, while key resistance is placed at AUD 0.014.
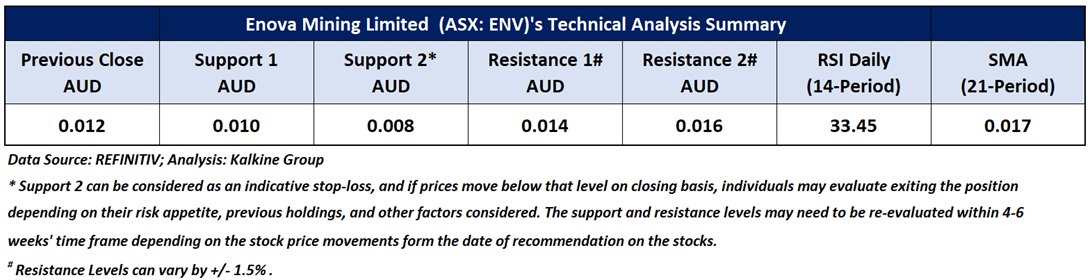
Daily Technical Chart – ENV
Individuals can evaluate the stock based on the support and resistance levels provided in the report in case of keen interest, taking into consideration the risk-reward scenario.
Considering the stock’s current price levels froming lower lows and lower highs, and momentum oscillator analysis, a “Watch” recommendation is given on the stock. The stock was analysed as per the closing price of AUD 0.012 per share as on 24 June 2024, down by 14.29%.
Note 1: Past performance is neither an Indicator nor a guarantee of future performance.
Note 2: Investment decision should be made depending on an individual’s appetite for upside potential, risks, and any previous holdings. This recommendation is purely based on technical analysis, and fundamental analysis has not been considered in this report.
Note 3: Related Risks: This report may be looked at from high-risk perspective and recommendations are provided are for a short duration. Recommendations provided in this report are solely based on technical parameters, and the fundamental performance of the stocks has not been considered in the decision-making process. Other factors which could impact the stock prices include market risks, regulatory risks, interest rates risks, currency risks, social and political instability risks etc.
The reference date for all price data, currency, technical indicators, support, and resistance levels is June 24, 2024. The reference data in this report has been partly sourced from REFINITIV.
Technical Indicators Defined:
Support: A level at which the stock prices tend to find support if they are falling, and a downtrend may take a pause backed by demand or buying interest. Support 1 refers to the nearby support level for the stock and if the price breaches the level, then Support 2 may act as the crucial support level for the stock.
Resistance: A level at which the stock prices tend to find resistance when they are rising, and an uptrend may take a pause due to profit booking or selling interest. Resistance 1 refers to the nearby resistance level for the stock and if the price surpasses the level, then Resistance 2 may act as the crucial resistance level for the stock.
Stop-loss: It is a level to protect further losses in case of unfavourable movement in the stock prices.
The Green colour line reflects the 21-period moving average. SMA helps to identify existing price trends. If the prices are trading above the 21-period, prices are currently in a bullish trend (Vice – Versa).
The Blue colour line reflects the 50-period moving average. SMA helps to identify existing price trends. If the prices are trading above the 50-period, prices are currently in a bullish trend (Vice – Versa).
The Orange/ Yellow colour line represents the Trendline.
The Purple colour line in the chart’s lower segment reflects the Relative Strength Index (14-Period), which indicates price momentum and signals momentum in trend. A reading of 70 or above suggests overbought status, while a reading of 30 or below suggests an oversold status.
 AU
AU

 Please wait processing your request...