Jupiter Mines Limited

JMS Details

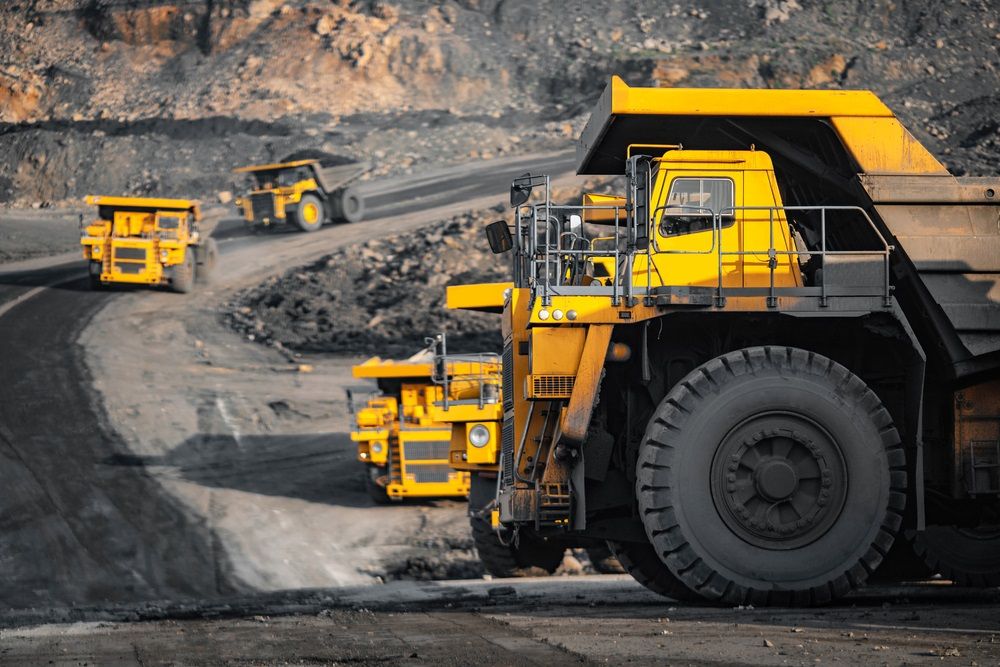
Q2FY22 (August Quarter) Financial Performance: Jupiter Mines Limited (ASX: JMS) operates in mineral investment that develops mineral resources properties and explores manganese deposits. It owns 49.9% beneficial interest in Tshipi.
- The company has recorded a decline in its sales revenue to $106.9 million in Q2FY22, compared to $154.1 million in Q2FY21, impacted due to excavator breakdowns, inclement weather, and operator issues.
- In addition, net profit decreased to $15.3 million in Q2FY22 vs $51.1 million in Q2FY21. The lower average exchange rate and disruption in logistics have impacted the earnings.
- However, in Q2FY22, the net cash from operating activities was at $38.7 million against neagtive $9.3 million on pcp basis.
- JMS reported an improved mining volume of 3.94 million bcm in Q2FY22, an increase from 3.41 million bcm in Q2FY21 and production improved to 945k tonnes in Q2FY22.
- At the end of the period, the company’s cash position (including its share of Tshipi cash) stood at $68.71 million as of end of August 2021.

Cash and Cash Equivalent (Source: Analysis by Kalkine Group)
Key Risks:
- Foreign Currency Risk- The company’s operations are exposed to the global market, due to which the company could face the foreign currency risk.
- Logistic Risk- The company is prone to the risk associated with its logistic and sales activities that could impact its operations in the near-term future.
Outlook: The company expects to mine Tshipi’s first ore in September 2021 and continue to improve high-grade ore production going forward.
Valuation Methodology: Price/Earnings Multiple Based Relative Valuation (Illustrative)

Source: Analysis by Kalkine Group
*% Premium/(Discount) is based on our assessment of the company’s NTM trading multiple after considering its key growth drivers, economic moat, stock's historical trading multiples versus peer average/median, and investment risks.
Stock Recommendation: The stock of JMS is trading below its average 52-weeks' levels of $0.202-$0.375. The stock of JMS gave a negative return of ~26.66% in the past three months and a negative return of ~14.66% in the past one year. The stock has been valued using Price/Earnings multiple-based illustrative relative valuation and arrived at a target price of low double-digit upside (in % terms). The company might trade at a slight discount to its peers' average P/E multiple, considering the impact of COVID-19 on the logistics front and a lower asset turnover ratio. For the purpose of valuation, peers such as BHP Group Ltd (ASX: BHP), Rio Tinto Ltd (ASX: RIO), Mineral Resources Ltd (ASX: MIN) and others have been considered. Considering the current trading levels, indicative upside in valuation, improved mining volume, increased production, optimistic outlook, and the key risks associated with the business, we recommend a 'Speculative Buy' rating on the stock at the current market price of $0.210, down by ~2.32% as on 5 October 2021.


JMS Daily Technical Chart, Data Source: REFINITIV
MACA Limited

MLD Details

Appointed/Retirement in the Board: MACA Limited (ASX: MLD) is engaged in contract mining, civil and infrastructure, and structural, mechanical, and piping businesses that include road construction, maintenance, drainage activity in Australia and Cambodia. Recently, Mr Linton Kirk, non-executive director, has retired from the company, and Mr David Flanagan has joined the board as an Independent Non-Executive Director.
Change in Director’s Interest- The company’s director, Michael Sutton, has undergone a change of interest and acquired 50,000 ordinary shares of the company for a total consideration of $32,750.
FY21 Financial Performance:
- The company has recorded revenue growth of 45% to $1,173.9 million in FY21, compared to $808.0 million in FY20, driven by geographical expansion, increased scale, capability and commodity diversification in mining business.
- The company delivered an improved EBITDA of 17% to $140.4 million in FY21 against $120.4 million in FY20, driven by a continuous focus on operational productivity and cost management.
- MACA has reported an NPAT of $20.7 million in FY21. The strategic acquisition of Mining West business and diversification enhanced the company’s earnings during the period.
- At the end of the period, the company’s cash position stood at $122.34 million as of 30 June 2021, an increase from $114.65 million as of 30 June 2020.

Revenue Trend (Source: Analysis by Kalkine Group)
Key Risks:
- Impact of COVID-19 pandemic- The company expects to face challenges in the labour market due to COVID restrictions which might have an impact across the sector.
- Demand Risk- The company is exposed to volatile commodity prices risk, economic risk and any delay in completion of contract could directly impact the profitability of the company in near term future.
Outlook:
- The company is well-positioned with a record order book and with secured $1.2 bn of work in hand in the mining division for FY22. Further, it continues to focus on improvement on operational performance going forward.
- MACA is actively pursued towards mining, civil and infrastructure opportunities and expects revenue of $1.4 billion in FY22.
- MACA also plans to focus on operational productivity and other initiatives to improve and protect margins from strengthening earning sustainability.
Valuation Methodology: EV/Sales Multiple Based Relative Valuation (Illustrative)

Source: Analysis by Kalkine Group
*% Premium/(Discount) is based on our assessment of the company’s NTM trading multiple after considering its key growth drivers, economic moat, stock's historical trading multiples versus peer average/median, and investment risks.
Stock Recommendation: The stock of MLD is trading below its average 52-weeks' levels of $0.645-$1.515. The stock of MLD gave a positive return of ~1.119% in the past one week and a negative return of ~18.24% in the past one year. The stock has been valued using EV/Sales multiple-based illustrative relative valuation and arrived at a target price of low double-digit upside (in % terms). The company might trade at a slight discount to its peers' average EV/Sales multiple, considering the impact of the COVID-19 pandemic and a lower gross margin. For the purpose of valuation, peers such as Macmahon Holdings Ltd (ASX: MAH), Mastermyne Group Ltd (ASX: MYE), Aeon Metals Ltd (ASX: AML) and others have been considered. Considering the current trading levels, indicative upside in valuation, strong financial performance, strategic acquisition, projects in the pipeline, optimistic outlook, and the key risks associated with the business, we recommend a 'Speculative Buy' rating on the stock at the current market price of $0.675, as on 5 October 2021, 11:56 AM (GMT+10), Sydney, Eastern Australia.


MLD Daily Technical Chart, Data Source: REFINITIV
Tempus Resources Limited

TMR Details

Identified Gold Vein Zone: Tempus Resources Limited (ASX: TMR) operates in the development, exploration, and extraction of copper and other mineral deposits in Australia, Canada, and Ecuador. Recently, the company has discovered a gold vein zone from drill-hole EZ-21-12 at Elizabeth project located approximately 150 metres to the northwest of the SW Vein. Further, it continues its diamond drill which demonstrates the SW Vein extends down-dip and along strike.
Q4FY21 and FY21 Financial Performance:
- The company has recorded exploration, and evaluation assets at $11.49 as of 30 June 2021.
- The company has reported an increase in loss to $3.14 million in FY21 against a loss of $2.86 million in FY20, impacted by an increase in legal and regulatory costs.
- It has reported other income of $15,761 in FY21 compared to $23,055 in FY20. However, the total assets has increased to $13.31 million as of 30 June 2021 vs $9.57 million in pcp end, resulting from intensive exploration activities.
- The cash and cash equivalent stood at $1.018 million as of 30 June 2021, an increase from $656k as of 31 March 2021.

Trade and other receivables (Source: Analysis by Kalkine Group)
Key Risks:
- Geological Risk: The company is exposed to geological risk; any negative report could impact its operations.
- Liquidity Risk- The company requires sufficient liquidity to meet the financial obligation, operational activity, exploration, and drilling activity.
Outlook:
- The company’s igneous intrusion, the Blue Lake Porphyry, is up to four to five times larger than previously interpreted. Moreover, it has a potential vertical depth of up to 2,000 metres.
- Tempus Blackdome exploration plan extends deeper than previously thought, with multiple, high-grade assays reported undermined stopes, and the company plans to follow up he work in 2022.
Stock Recommendation: As per a recent update, the company has completed ~$6.3 million placement on 26 August 2021 at an average price of $0.251 per share. The stock of TMR is trading below its average 52-weeks' levels of $0.145-$0.310. The stock of TMR gave a positive return of ~9.67% in the past six months and a negative return of ~26.08% in the past one year. Considering the current trading levels, successful capital raise, expanding its footprint, increasing drilling program optimistic outlook, and the key risks associated with the business, we recommend a 'Speculative Buy' rating on the stock at the current market price of $0.165, as on 5 October 2021, 12:30 PM (GMT+10), Sydney, Eastern Australia.


TMR Daily Technical Chart, Data Source: REFINITIV
Note 1: The reference data in this report has been partly sourced from REFINITIV
Note 2: Investment decisions should be made depending on the investors’ appetite on upside potential, risks, holding duration, and any previous holdings. Investors can consider exiting from the stock if the Target Price mentioned as per the analysis has been achieved and subject to the factors discussed above alongside support levels provided.
Technical Indicators Defined: -
Support: A level where-in the stock prices tend to find support if they are falling, and downtrend may take a pause backed by demand or buying interest.
Resistance: A level where-in the stock prices tend to find resistance when they are rising, and uptrend may take a pause due to profit booking or selling interest.
Stop-loss: It is a level to protect further losses in case of unfavourable movement in the stock prices.
Disclaimer - This report has been issued by Kalkine Pty Limited (ABN 34 154 808 312) (Australian financial services licence number 425376) (“Kalkine”) and prepared by Kalkine and its related bodies corporate authorised to provide general financial product advice. Kalkine.com.au and associated pages are published by Kalkine.
Any advice provided in this report is general advice only and does not take into account your objectives, financial situation or needs. You should therefore consider whether the advice is appropriate to your objectives, financial situation and needs before acting upon it.
There may be a Product Disclosure Statement, Information Statement or other offer document for the securities or other financial products referred to in Kalkine reports. You should obtain a copy of the relevant Product Disclosure Statement, Information Statement or offer document and consider the statement or document before making any decision about whether to acquire the security or product.
You should also seek advice from a financial adviser, stockbroker or other professional (including taxation and legal advice) as necessary before acting on any advice in this report or on the Kalkine website. Not all investments are appropriate for all people.
The information in this report and on the Kalkine website has been prepared from a wide variety of sources, which Kalkine, to the best of its knowledge and belief, considers accurate. Kalkine has made every effort to ensure the reliability of information contained in its reports, newsletters and websites. All information represents our views at the date of publication and may change without notice.
Kalkine does not guarantee the performance of, or returns on, any investment. To the extent permitted by law, Kalkine excludes all liability for any loss or damage arising from the use of this report, the Kalkine website and any information published on the Kalkine website (including any indirect or consequential loss, any data loss or data corruption). If the law prohibits this exclusion, Kalkine hereby limits its liability, to the extent permitted by law, to the resupply of services.
Please also read our Terms & Conditions and Financial Services Guide for further information.
On the date of publishing this report (referred to on the Kalkine website), employees and/or associates of Kalkine and its related entities do not hold interests in any of the securities or other financial products covered on the Kalkine website.
Kalkine Media Pty Ltd, an affiliate of Kalkine Pty Ltd, may have received, or be entitled to receive, financial consideration in connection with providing information about certain entity(s) covered on its website.
 AU
AU
 Please wait processing your request...