Deterra Royalties Limited

DRR Details

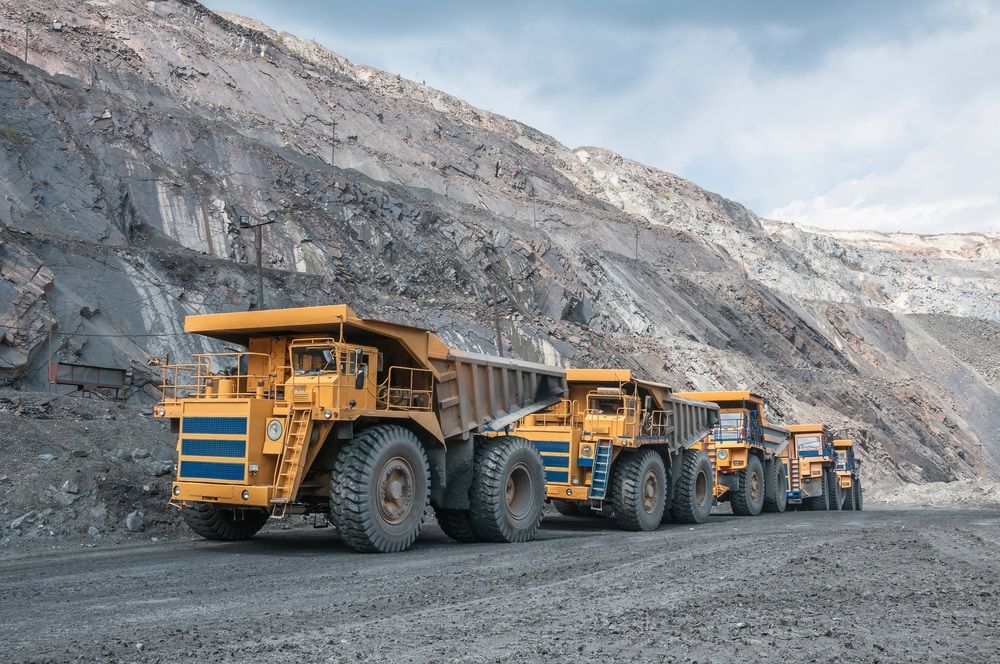
Change in Shareholding: Deterra Royalties Limited (ASX: DRR) operates in a royalty business model that involves managing and investing a portfolio of royalties across bulk commodities, base metals, and battery metals in Australia. On 1 October 2021, Schroder Investment Management Australia Limited and its related bodies corporate became a substantial shareholder with 5.01% voting rights in DRR.
Change in Director’s Holding: Director, Joanne Warner, held 50,000 shares in DRR via an on-market trade of 7,000 ordinary shares for a consideration of $26,670.
FY21 Key Takeaways:
- DRR Incorporation & ASX Listing: DRR was incorporated on 15 June 2020. During FY21, DRR and its controlled companies (Deterra Royalties Holdings Pty Limited and Deterra Royalties (MAC) Limited) demerged from Iluka Resources Limited (Iluka), its former parent company, and got listed on ASX.
- Earnings Recorded: The company posted $145.2 million in revenue and an NPAT of $94.3 million in FY21. The Underlying EBITDA stood at $135.5 million after post-demerger with a margin of 96% in FY21.
- Dividend Declared: A fully franked final dividend of 11.52 cents per share was declared with a payment date of 22 September 2021, taking the total dividend to 13.97 cents per share in FY21.
- Cash & Debt Position: DRR held $24.20 million cash and cash equivalents and total debt of $311,000 as of 30 June 2021.

Total Revenue & Net Income Growth Highlights; (Analysis by Kalkine Group)
Key Risks: DRR faces changes in the iron ore production and price, forex changes, demand risk caused due to COVID-19, supply constraints) mainly in Brazil), etc.
Outlook:
- DRR expects to ramp up production volume to 145 million wet metric tonnes per year at Mining Area C (MAC) in the next three years by operating at total capacity at South Flank.
- DRR expects to benefit from the capacity expansion via royalty payments from MAC sales and additional capacity payments.
- DRR plans to assess options to generate more royalty assets, however, in a patient and disciplined manner based on its ESG and value-accretive growth criteria.
- The company will hold its Annual General Meeting (AGM) on 20 October 2021.
Valuation Methodology: EV/EBITDA Multiple Based Relative Valuation (Illustrative)

Source: Analysis by Kalkine Group
*% Premium/(Discount) is based on our assessment of the company’s NTM trading multiple after considering its key growth drivers, economic moat, stock's historical trading multiples versus peer average/median, and investment risks.
Stock Recommendation: The stock of DRR gave a negative return of ~9.09% in the past month and a negative return of ~15.15% in the past three months. The stock is currently trading lower than the 52-weeks’ average price level of $3.520 - $5.350. The stock has been valued using the Enterprise Value to EBITDA based illustrative relative valuation method and arrived at a target price of low double-digit upside (in % terms). The company might trade at some premium than its peers’ average EV/EBITDA, considering its decent financial performance in FY21, global steel demand recovery, and expected short-term production increase. For this purpose of valuation, few peers like Pilbara Minerals Limited (ASX: PLS), Mineral Resources Limited (ASX: MIN), Sims Limited (ASX: SGM), and others have been considered. Considering the current trading levels, revenue generation and NPAT in FY21, the first production at BHP’s South Flank, plans to increase production capacity at South Flank, and indicative upside in valuation, we give a ‘Buy’ rating on the stock at the current market price of $3.580, as on 7 October 2021, 10:30 AM, (GMT+10), Sydney, Eastern Australia.


DRR Daily Technical Chart, Data Source: REFINITIV
St Barbara Limited

SBM Details

Proposal Rejected: St Barbara Limited (ASX: SBM) undertakes gold mining in Australia, Canada, and Papua New Guinea. SBM assets include Simberi operations, Leonora operations, and Atlantic operations. On 7 October 2021, Kin Mining NL (ASX: KIN) informed the market regarding its decision to reject a NIBO (non-binding indicative proposal) by SBM to purchase KIN. SBM offered to buy KIN shares at $0.16 per KIN share. However, the NBIO was rejected by KIN as the deal would not have been sanctioned by the required majority (75%) voting.
Reduced Shareholding: On 1 October 2021, Schroder Investment Management Australia Limited and its associated entities reduced shareholding from 6.68% to 5.60% in SBM.
FY21 Highlights:
- The company reported 327,662 ounces of gold production in FY21 versus 381,887 in FY20, primarily due to the planned development at Leonora and cessation of mining at Simberi.
- SBM generated $41 million of savings from its Building Brilliance transformation program at Atlantic Operations, executed successfully and exceeding the target of $30-$40 million. SBM registered 2,918 kt of yearly mill throughput at Atlantic Operations in FY21.
- The net cash inflows from operating activities stood at $227.09 million in FY21 versus $279.53 million in FY20.
- SBM reported a 4% YoY increase in gold ore reserves to 6.2 million ounces in FY21. The company added 1.4 million gold ounces to its Leonora Province due to the recent work undertaken.
- SBM declared a fully franked total dividend of 6 cents per share for FY21, including 4 cents of interim dividend and 2 cents per share of final dividend.
- SBM held $133.37 million cash and cash equivalents as of 30 June 2021. The total interest-bearing liabilities were reduced from $331.76 million as of 30 June 2020 to $109.25 million as of 30 June 2021.

Total Debt Highlights; (Analysis by Kalkine Group)
Key Risks: The company faces forex headwinds, changes in the USD spot gold price, government regulations, and operating risks and hazards.
Outlook:
- SBM expects FY21 gold production within 305,000 - 355,000 ounces and AISC in the range of $1,710 -$1,860 per ounce.
- SBM estimates $95 million - $115 million of sustaining capital expenditure and $70 - $95 million of growth capital.
- The estimated exploration expenditure for FY21 will be between $28 million and $32 million.
- SBM plans to extend the life of each operation via planned exploration programs in FY22. The focus will be to increase the potential for near-mine ore sources around -Gwalia mine, Touquoy mine, Simberi mine and mining lease ML136.
Valuation Methodology: EV/Sales Multiple Based Relative Valuation (Illustrative)

Source: Analysis by Kalkine Group
*% Premium/(Discount) is based on our assessment of the company’s NTM trading multiple after considering its key growth drivers, economic moat, stock's historical trading multiples versus peer average/median, and investment risks.
Stock Recommendation: The stock of SBM gave a negative return of ~23.01% in the past three months and a negative return of ~31.04% in the past six months. The stock is currently trading lower than the 52-weeks’ average price level of $1.255 - $3.170. The stock has been valued using the Enterprise Value to Sales based illustrative relative valuation method and arrived at a target price of low double-digit upside (in % terms). The company might trade at some discount than its peers’ median EV/Sales multiple, considering its net loss after tax and lower revenue in FY21, the associated risks of COVID-19, forex changes, and lower production forecast for FY22. For this purpose of valuation, few peers like Red 5 Limited (ASX: RED), Regis Resources Limited (ASX: RRL), Ramelius Resources Limited (ASX: RMS), and others have been considered. Considering the current trading levels, reduction in interest-bearing liabilities, and cash benefits from Building Brilliance program in FY21, and valuation, we give a ‘Buy’ rating on the stock at the current market price of $1.435, on 7 October 2021, 10:30 AM, (GMT+10), Sydney, Eastern Australia.


SBM Daily Technical Chart, Data Source: REFINITIV
Note 1: The reference data in this report has been partly sourced from REFINITIV.
Note 2: Investment decision should be made depending on the investors’ appetite on upside potential, risks, holding duration, and any previous holdings. Investors can consider exiting from the stock if the Target Price mentioned as per the Valuation has been achieved and subject to the factors discussed above.
Technical Indicators Defined: -
Support: A level where-in the stock prices tend to find support if they are falling, and downtrend may take a pause backed by demand or buying interest.
Resistance: A level where-in the stock prices tend to find resistance when they are rising, and uptrend may take a pause due to profit booking or selling interest.
Stop-loss: It is a level to protect further losses in case of unfavourable movement in the stock prices.
Disclaimer - This report has been issued by Kalkine Pty Limited (ABN 34 154 808 312) (Australian financial services licence number 425376) (“Kalkine”) and prepared by Kalkine and its related bodies corporate authorised to provide general financial product advice. Kalkine.com.au and associated pages are published by Kalkine.
Any advice provided in this report is general advice only and does not take into account your objectives, financial situation or needs. You should therefore consider whether the advice is appropriate to your objectives, financial situation and needs before acting upon it.
There may be a Product Disclosure Statement, Information Statement or other offer document for the securities or other financial products referred to in Kalkine reports. You should obtain a copy of the relevant Product Disclosure Statement, Information Statement or offer document and consider the statement or document before making any decision about whether to acquire the security or product.
You should also seek advice from a financial adviser, stockbroker or other professional (including taxation and legal advice) as necessary before acting on any advice in this report or on the Kalkine website. Not all investments are appropriate for all people.
The information in this report and on the Kalkine website has been prepared from a wide variety of sources, which Kalkine, to the best of its knowledge and belief, considers accurate. Kalkine has made every effort to ensure the reliability of information contained in its reports, newsletters and websites. All information represents our views at the date of publication and may change without notice.
Kalkine does not guarantee the performance of, or returns on, any investment. To the extent permitted by law, Kalkine excludes all liability for any loss or damage arising from the use of this report, the Kalkine website and any information published on the Kalkine website (including any indirect or consequential loss, any data loss or data corruption). If the law prohibits this exclusion, Kalkine hereby limits its liability, to the extent permitted by law, to the resupply of services.
Please also read our Terms & Conditions and Financial Services Guide for further information.
On the date of publishing this report (referred to on the Kalkine website), employees and/or associates of Kalkine and its related entities do not hold interests in any of the securities or other financial products covered on the Kalkine website.
Kalkine Media Pty Ltd, an affiliate of Kalkine Pty Ltd, may have received, or be entitled to receive, financial consideration in connection with providing information about certain entity(s) covered on its website.
 AU
AU
 Please wait processing your request...