Enphase Energy, Inc.
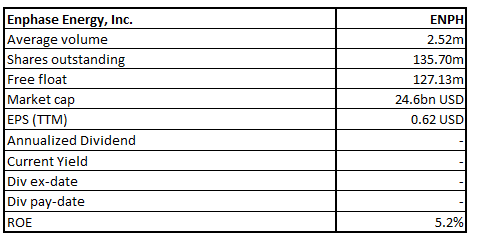
ENPH Details
Enphase Energy, Inc. (NASDAQ: ENPH) is a global energy technology company that manages the solar generation, storage, and communication under its umbrella. Further, it offers microinverters and Enphase residential and commercial systems to over 130 countries.
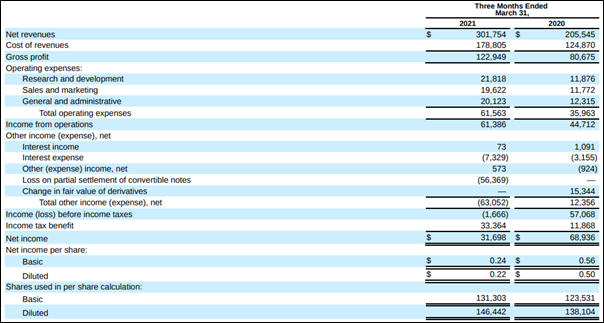
Result Performance – For the First Quarter Ended 31 March 2021 – (Q1FY21)
For the first quarter ended 31 March 2021, net revenues grew by 47% YoY to $301.8 million mainly due to the 22% rise in the microinverter unit volume shipped mainly due to business growth in the US. In addition, the revenue was supported by the favourable product mix as it sold more IQ 7+ microinverters compared to IQ 7 microinverters, followed by a rise in the average selling price due to customer mix, as well as shipments of Enphase Encharge storage systems to customers in North America. The company sold 2.5 million microinverter units in Q1FY21 over 2.0 million units in Q1FY20. Meanwhile, GAAP net income was reported at $31.7 million, including a non-cash loss of $56.4 million on the partial settlement of convertible notes, while non-GAAP net income stood at $78.7 million.
Key Data (Source: Company Reports)
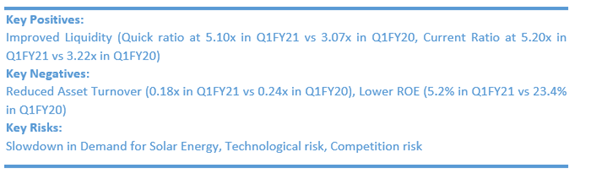
Risk:
The business is dependent on demand for solar energy solutions and if demand does not grow or grows at a slower rate, the business will suffer. The dynamics of the business are changing which makes it difficult to evaluate current business and prospects. Further, the company is dependent on suppliers for key components and products.
Outlook:
The company is expected to report revenue within the ambit of $300.0-$320.0 million, while the GAAP gross margin is expected in the range of 37.0-40.0% and non-GAAP gross margin to be between 38.0-41.0%, excluding stock-based compensation expenses. Further, GAAP operating expenses is expected between $70.0-$73.0 million, including $17.0 million assumed for stock-based compensation expenses and acquisition-related costs and amortization. The non-GAAP forecast includes increased investments in new products, software, and marketing and a $3.5 million accrual for deferred consideration from the acquisitions.
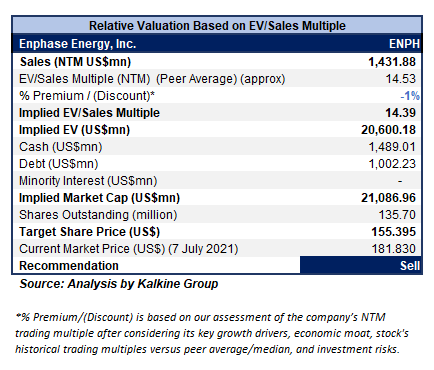
Valuation Methodology: EV/Sales Multiple Based Relative Valuation (Illustrative)
Technical Overview:
Weekly Chart –
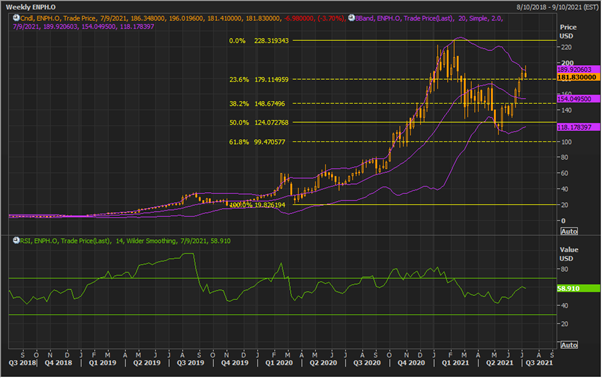
Source: REFINITIV
Note: Purple colour lines are Bollinger Bands® with the upper band suggesting overbought status while the lower band oversold status, and yellow lines are Fibonacci retracement lines which measure price rebound and backtrack. https://www.bollingerbands.com/
After having given correction beyond the 50% retracement level of $124.07, the stock rebounded beyond the 23.6% retracement level of $179.11 and has given a weaker close at $181.83 for the ongoing week, forming an ‘Inverted Hammer’ which is towards confirmation of a bearish reversal of the trend. The technical indicator RSI with a reading around 59 and a curve at the end pointing down suggests softening of bullish momentum for the stock.
Going forward, the stock may have resistance around $200 whereas support could be around the 38.2% retracement level of $148.67.
Stock Recommendation:
The stock has witnessed an increase of ~68.64% in 9 months and an increase of ~259.06% in 1 year. The stock has a 52-week low and high of $49.25 and $229.04, respectively.
Considering the aforesaid facts, we have valued the stock using an EV/Sales multiple-based illustrative relative valuation and have arrived at a target price that reflects a decline of low double-digit (in % terms). We have applied a slight discount to EV/Sales Multiple (NTM) (Peer Average) considering lower ROE and the associated business risks. Considering the movement in the stock price, we advise investors to liquidate the stock.
Thus, we give a “Sell” recommendation on the stock at the current market price of US$181.83 per share, down by 3.7% on 7th July 2021.
Note 1: The reference data in this report has been partly sourced from REFINITIV.
Note 2: Investment decisions should be made depending on the investors’ appetite on upside potential, risks, holding duration, and any previous holdings. Investors can consider exiting from the stock if the Target Price mentioned as per the analysis has been achieved and subject to the factors discussed above alongside support levels provided.
Technical Indicators Defined:-
Support: A level where-in the stock prices tend to find support if they are falling, and downtrend may take a pause backed by demand or buying interest.
Resistance: A level where-in the stock prices tend to find resistance when they are rising, and uptrend may take a pause due to profit booking or selling interest.
Disclaimer - This report has been issued by Kalkine Pty Limited (ABN 34 154 808 312) (Australian financial services licence number 425376) (“Kalkine”) and prepared by Kalkine and its related bodies corporate authorised to provide general financial product advice. Kalkine.com.au and associated pages are published by Kalkine.
Any advice provided in this report is general advice only and does not take into account your objectives, financial situation or needs. You should therefore consider whether the advice is appropriate to your objectives, financial situation and needs before acting upon it.
There may be a Product Disclosure Statement, Information Statement or other offer document for the securities or other financial products referred to in Kalkine reports. You should obtain a copy of the relevant Product Disclosure Statement, Information Statement or offer document and consider the statement or document before making any decision about whether to acquire the security or product.
You should also seek advice from a financial adviser, stockbroker or other professional (including taxation and legal advice) as necessary before acting on any advice in this report or on the Kalkine website. Not all investments are appropriate for all people.
The information in this report and on the Kalkine website has been prepared from a wide variety of sources, which Kalkine, to the best of its knowledge and belief, considers accurate. Kalkine has made every effort to ensure the reliability of information contained in its reports, newsletters and websites. All information represents our views at the date of publication and may change without notice.
Kalkine does not guarantee the performance of, or returns on, any investment. To the extent permitted by law, Kalkine excludes all liability for any loss or damage arising from the use of this report, the Kalkine website and any information published on the Kalkine website (including any indirect or consequential loss, any data loss or data corruption). If the law prohibits this exclusion, Kalkine hereby limits its liability, to the extent permitted by law, to the resupply of services.
Please also read our Terms & Conditions and Financial Services Guide for further information.
On the date of publishing this report (referred to on the Kalkine website), employees and/or associates of Kalkine do not hold interests in any of the securities or other financial products covered on the Kalkine website.
 AU
AU

 Please wait processing your request...