iShares S&P/ASX Dividend Opportunities ETF

IHD Details
Underperformed the benchmark: iShares S&P/ASX Dividend Opportunities ETF (ASX: IHD), which tracks S&P/ASX Dividend Opportunities Index, is reported to have a Distribution Reinvestment Plan unit price of 13.918336 during December 2016 quarter. The fund gives exposure to 50 high-dividend yielding Australian equities, helps seeking quarterly income diversified across sectors and target equity income while avoiding dividend traps. The fund is launched and managed by BlackRock Investment Management (Australia) Limited. The fund has largest exposure in Financials and then the telecommunications sector.
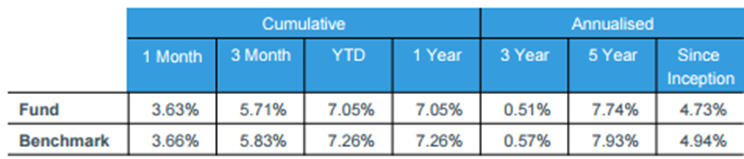
Cumulative and Annualized Performance (Source: BlackRock reports)
On the other hand, the fund was started in 2010, and has given just 4.73% returns since inception and has underperformed the benchmark. The group also reported a loss before finance costs attributable to unitholders of $23 million as at June 2016 against the profit of $2.7 million as at June 2015. We give an “Expensive” recommendation on the fund at the current price of – $ 13.83
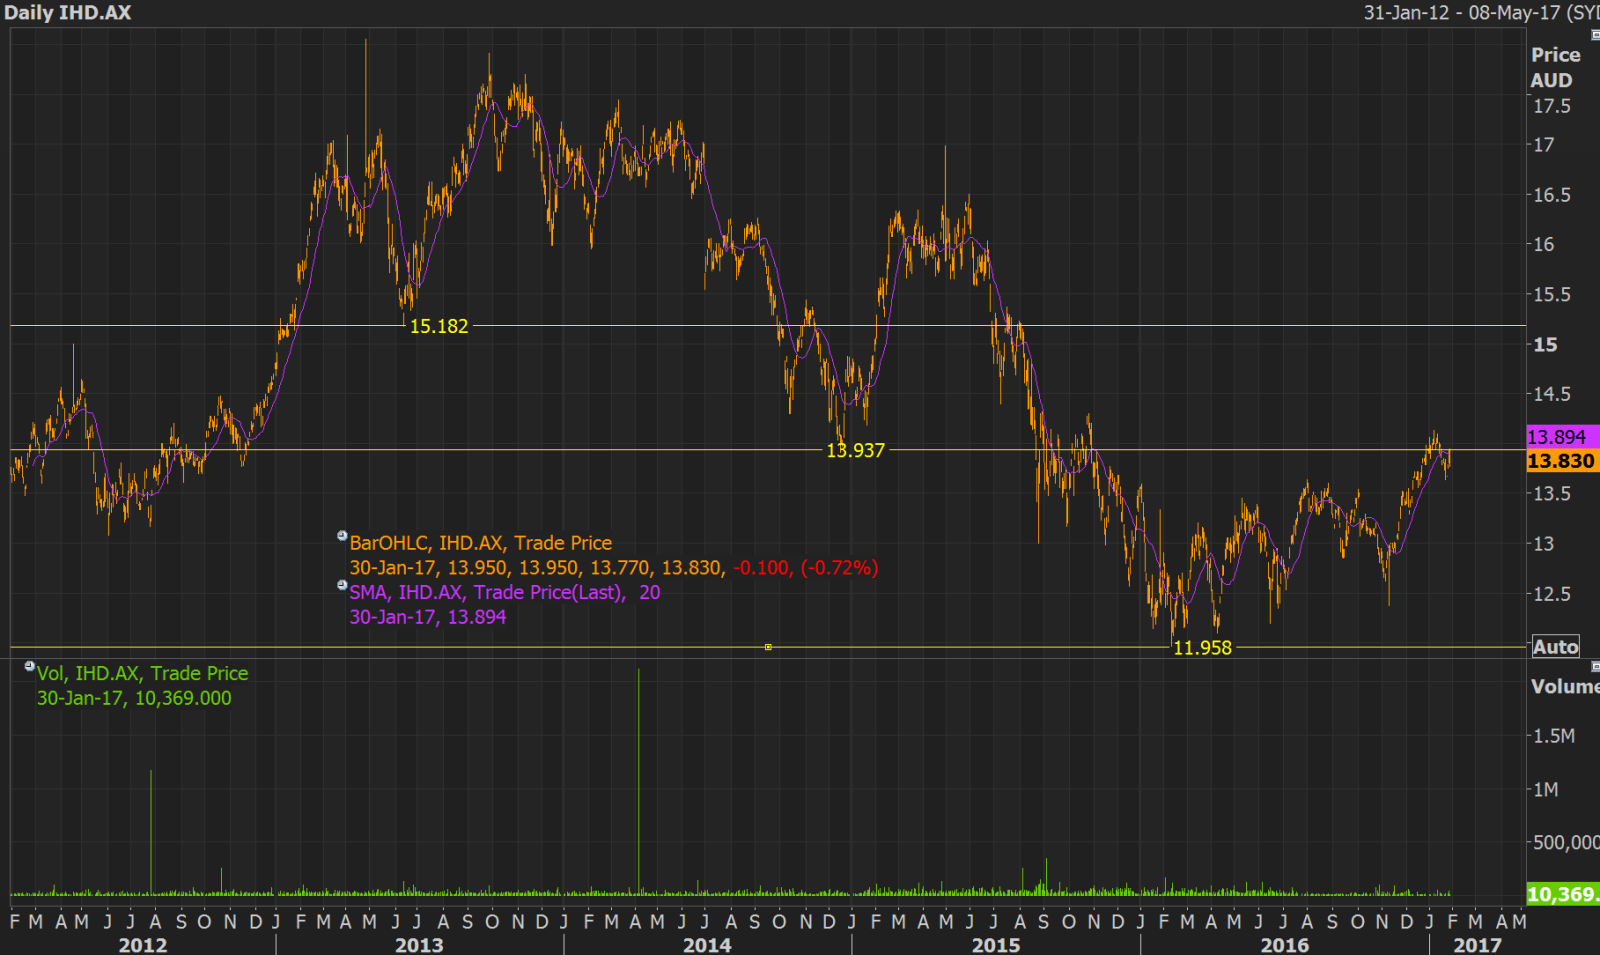
IHD Daily Chart (Source: Thomson Reuters)
BetaShares S&P 500 Yield Maximiser Fund

UMAX Details
Limited Upside: BetaShares S&P 500 Yield Maximiser Fund (ASX: UMAX) has an exchange-traded managed fund, aiming to provide an exposure to the equity securities that comprise S&P 500 Index. In addition, the fund aims to provide the potential for some capital growth and lower overall volatility than the Index. On the other hand, the fund’s one year returns after fees as of December 2016 is 8.22% against S&P 500 Index return of 11.76%, while the fund has a management cost of 0.79% per year. Top five sectors in which the fund has exposure include Technology, Financial services, Healthcare, Industrials and consumer cyclical. The fund reported outstanding units of 4,624,371 at the close of trading on December 30, 2016. Given the limited prospects, we give an “Expensive” recommendation on the fund at the current price of – $ 17.28
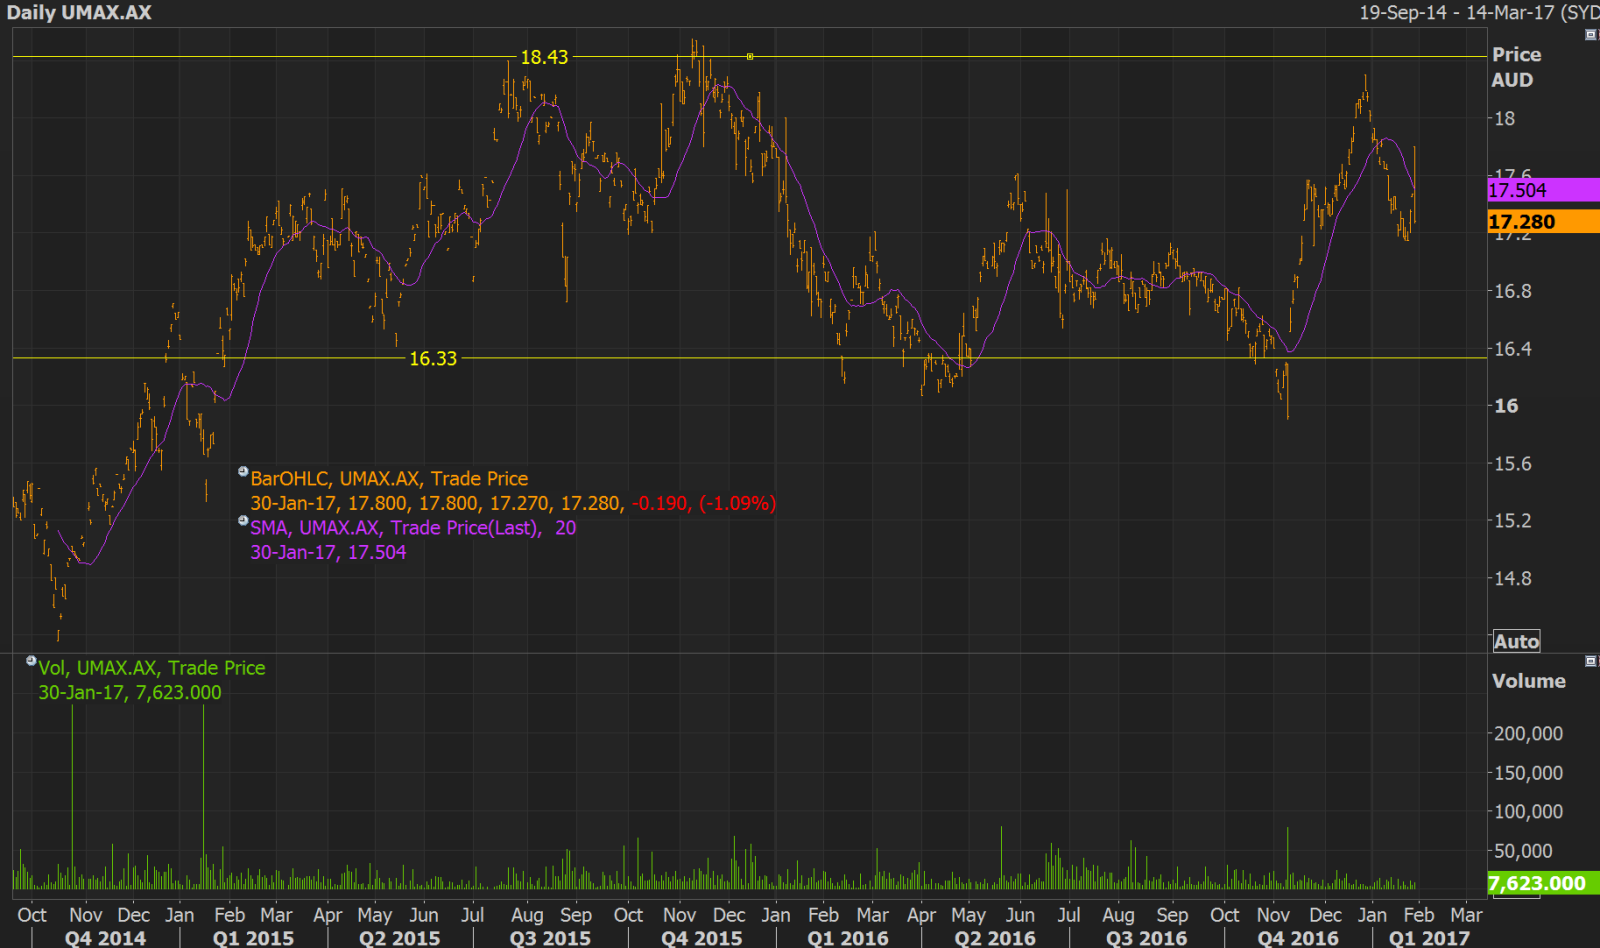
UMAX Daily Chart (Source: Thomson Reuters)
Vanguard MSCI Index International Shares ETF

VGS Details
Fund with no currency hedging: Vanguard MSCI Index International Shares ETF (ASX: VGS) tracks the MSCI World ex-Australia (with net dividends reinvested) in Australian dollars Index. The fund was incorporated and had exposure of over 1500 securities and 22 countries. The management cost for the fund is 0.18% per annum and has no currency hedging. The ETF has 10,000 minimum units per cash order to January 15, 2017 and new minimum 5,000 units per cash order from January 16, 2017. On the other hand, the current volatile conditions in the global markets could pose a risk to the fund and accordingly, we give an “Expensive” recommendation on the fund at the current price of – $ 58.57

VGS Daily Chart (Source: Thomson Reuters)
Vanguard Australian Shares High Yield ETF

VHY Details
One year performance slightly better than the benchmark: Vanguard Australian Shares High Yield ETF (ASX: VHY) tracks the return of the FTSE ASFA Australia High Dividend Yield Index before taking into account fees, expenses and tax. The fund has high exposure to Financials, Consumer Services and Industrials. The fund seems to have benefitted a little from recent global developments including the US election, but the returns could be limited in future due to the bond yield fluctuations and valuations.
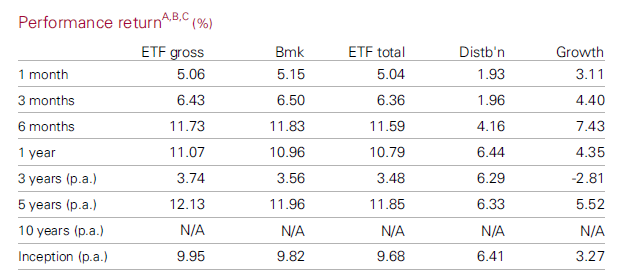
Fund Performance (Source: Vanguard Reports)
For last one year, the fund has performed slightly better than the benchmark. We give an “Expensive” recommendation on the fund at the current price of – $ 58.90
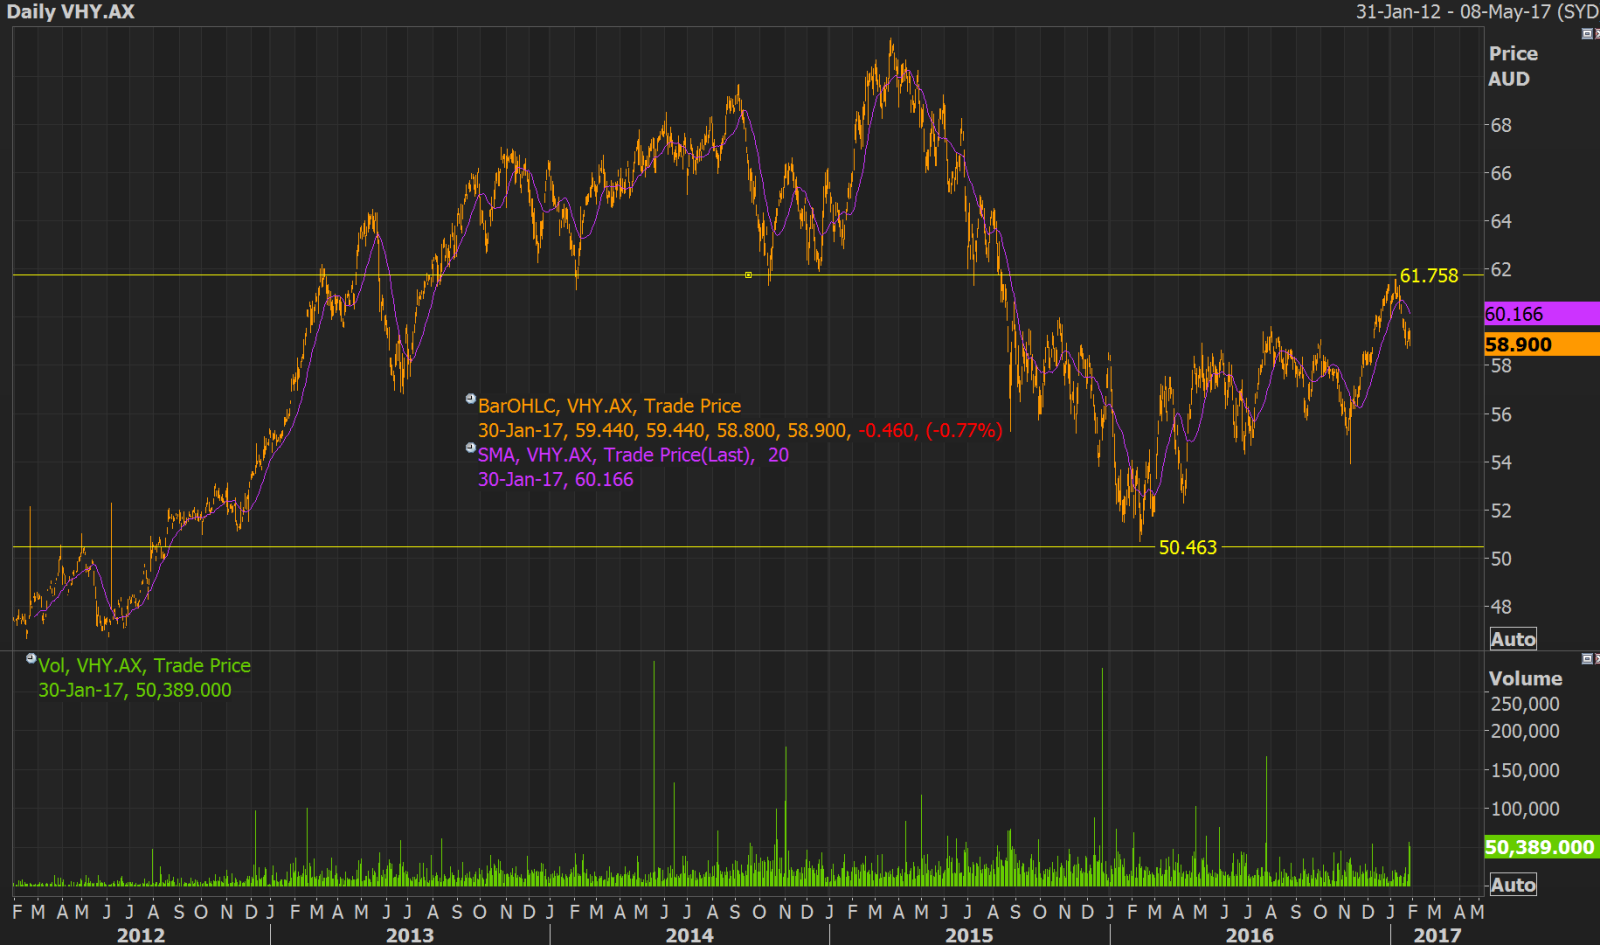
VHY Daily Chart (Source: Thomson Reuters)
Vanguard US Total Market Shares Index ETF

VTS Details
Tracking CRSP US Total Market Index: Vanguard US Total Market Shares Index ETF (ASX: VTS) tracks the performance of the CRSP US Total Market Index and provides access to some of the largest and best companies in the world like Alphabet (parent of Google), Apple, Microsoft, Amazon, GE, Berkshire Hathaway, AT&T etc. The ETF is exposed to fluctuating US currency and has performed just in line with the benchmark index in last one year and since inception. Based on the limited prospects, we believe the ETF is “Expensive” at the current price of – $ 156.16
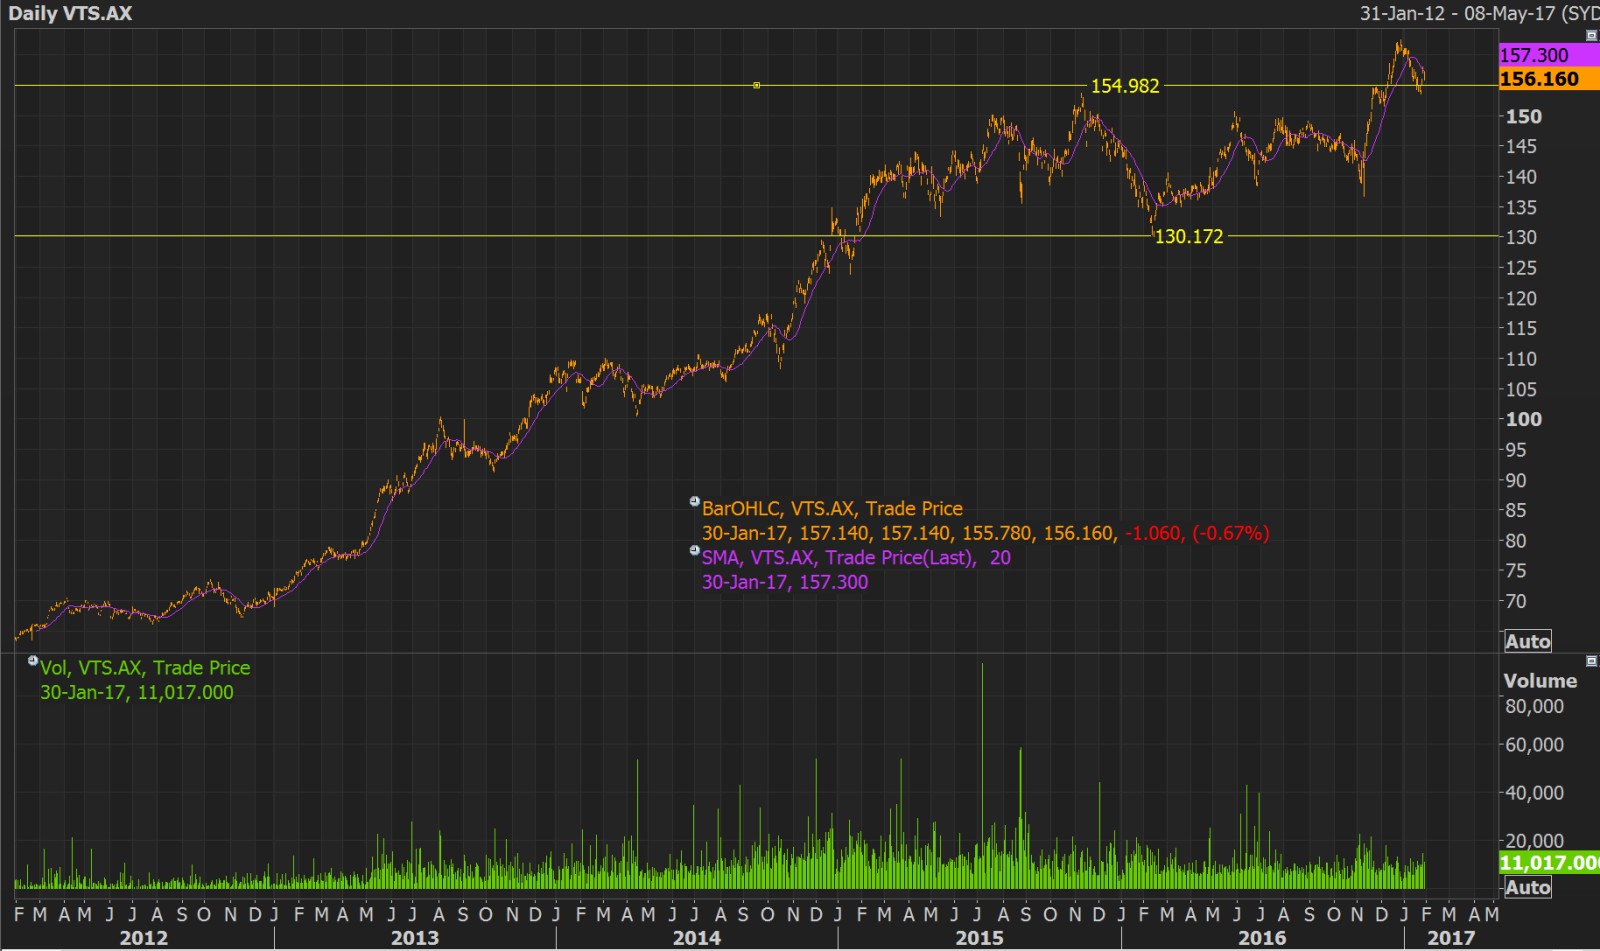
VTS Daily Chart (Source: Thomson Reuters)
ANZ ETFS Physical Gold ETF

ZGOL Details
Underperformed the benchmark: ANZ ETFS Physical Gold ETF (ZGOL) provides the investors with a beneficial interest in physical gold Bullion without the necessity of holding, trading and storing physical gold Bullion. ZGOL is backed by physical allocated gold held by Australia and New Zealand Banking Group Limited (which is the custodian) at its vault in Singapore. It tracks the benchmark index LBMA AM Gold Price and is found to have underperformed the benchmark. The fund has a management expense ratio of 0.40% per annum and has net asset value of 15.5739591. As on December 30, 2016, units on issue were 753,227. On the other hand, the recent fall in the gold prices could pose pressure on the fund’s performance. We give an “Expensive” recommendation on the fund at the current price of – $ 15.72
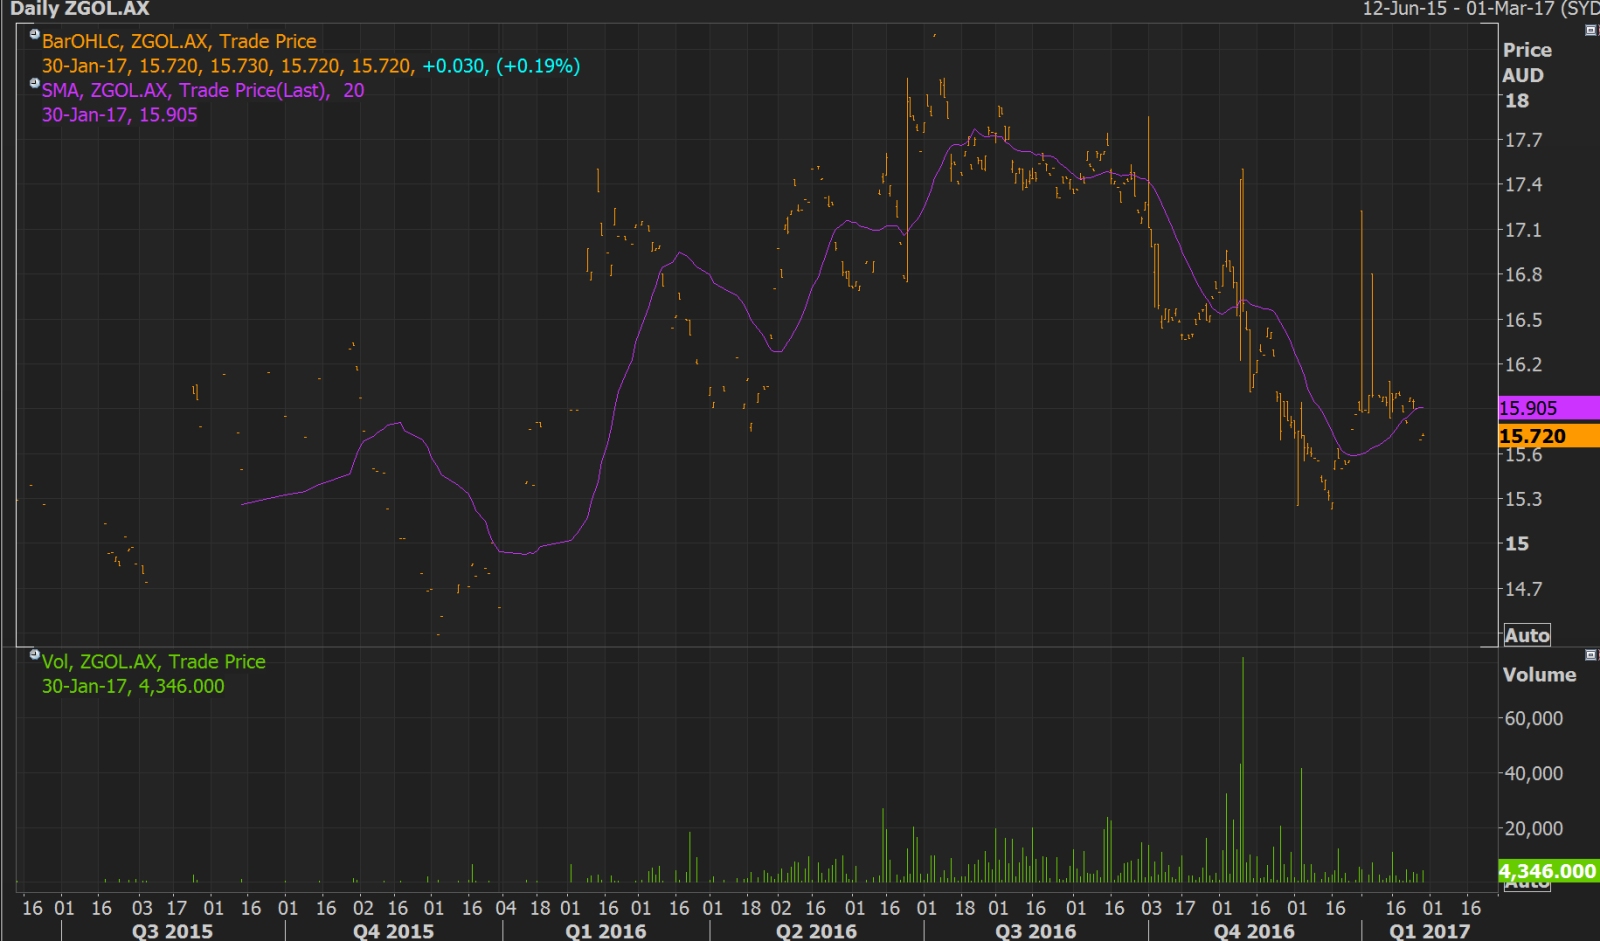
ZGOL Daily Chart (Source: Thomson Reuters)
Watermark Global Leaders Fund Ltd

WGF Details
Market neutral structure: Watermark Global Leaders Fund Ltd (ASX: WGF) was the third listed investment company managed by Watermark Funds Management, with its IPO contributing to the fund’s total funds under management (FUM) of over $700 million. The IPO closed in December 2016 and does not have long history of performance. The fund provides access to an actively managed portfolio of global equities in a market neutral structure. WGF’s market neutral structure uses long and short positions to give consistent, positive returns of 10% or more through market cycles and has no correlation to the share market. The first annual report is expected to be published for a period commencing August 2016 and ending June 2017. The stock has fallen 2.79% since the start of trading (as at January 27, 2017) and was up about 0.5% on January 30, 2017. It might be too early to evaluate prospects of the fund while we give an “Expensive” recommendation at the current price of – $ 1.05
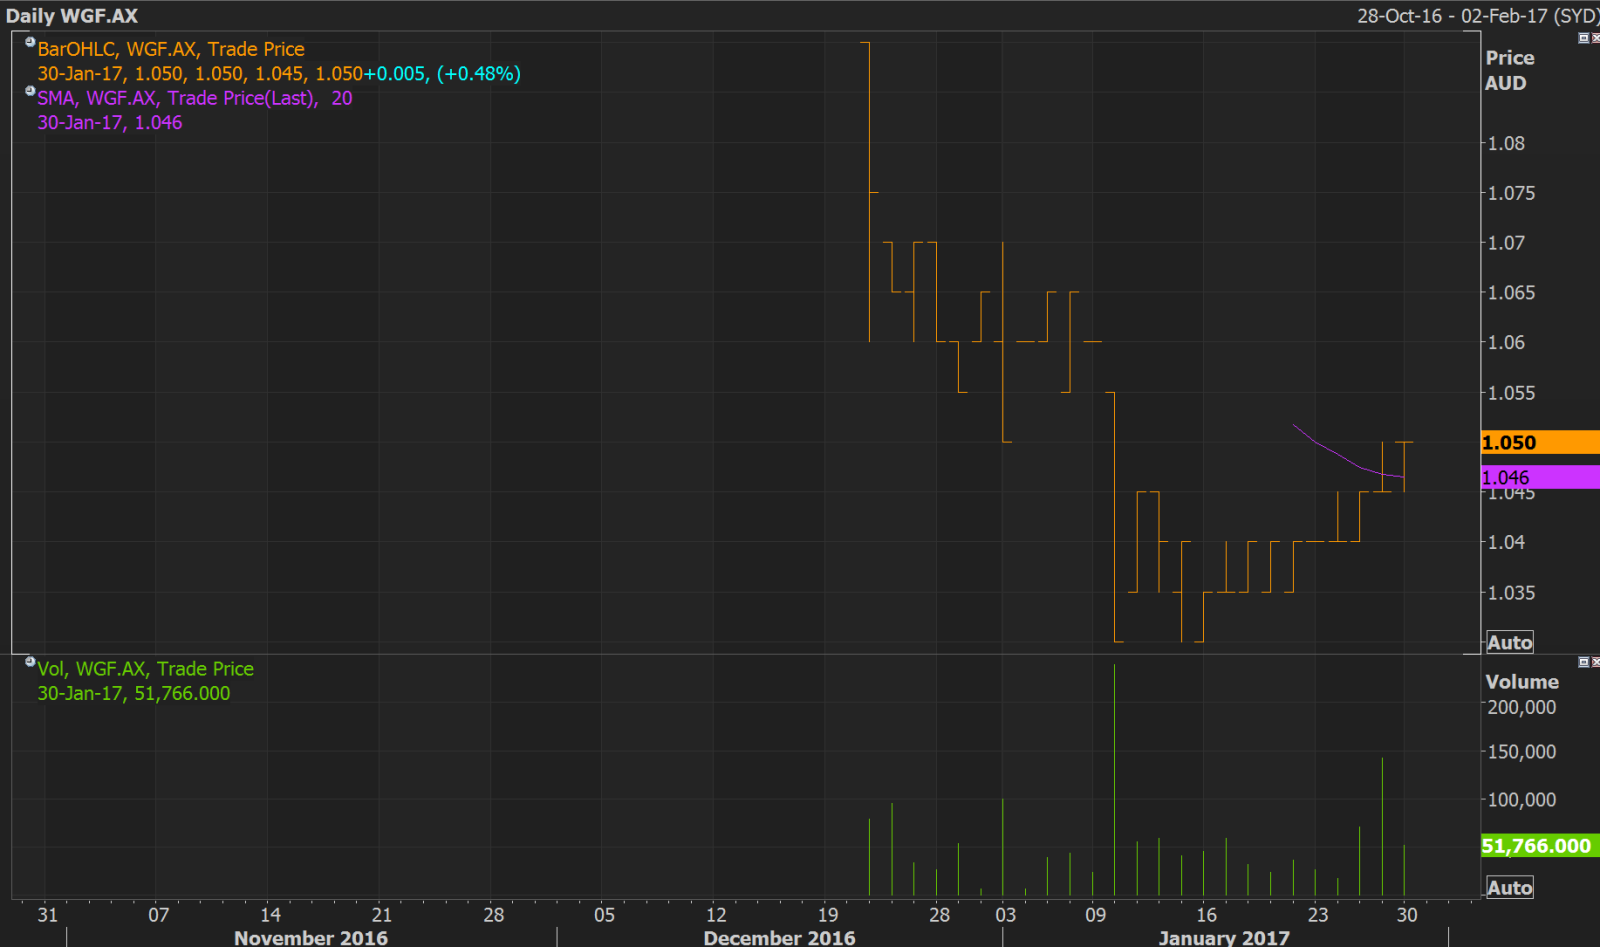
WGF Daily Chart (Source: Thomson Reuters)
PM Capital Global Opportunities Fund Ltd

PGF Details
Concentrated portfolio of undervalued global equities: PM Capital Global Opportunities Fund Ltd (ASX: PGF) provides long-term capital growth by investing in a concentrated portfolio of undervalued global (including Australian) equities and other investment securities. Particularly, the fund is a concentrated portfolio of over 40 globally-listed equities. The maximum total net invested position is 130% of the portfolio’s net market value, while debt exposures are allowed up to 30%. The unlisted securities may represent up to 10% of the portfolio's net market value.
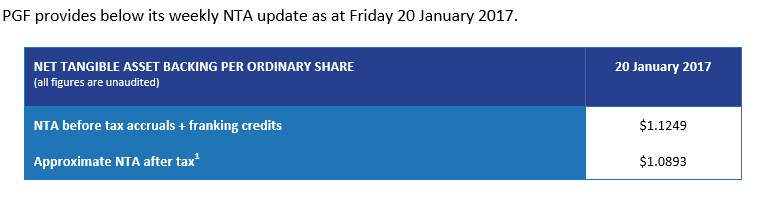
NTA Update (Source: Company Reports)
The Net Tangible Asset after tax for the week as at January 20, 2017, declined a bit from that witnessed for the week of January 13, 2017. The stock is trading close to its 52-week high price. We give an “Expensive” recommendation on the fund at the current price of – $ 0.99
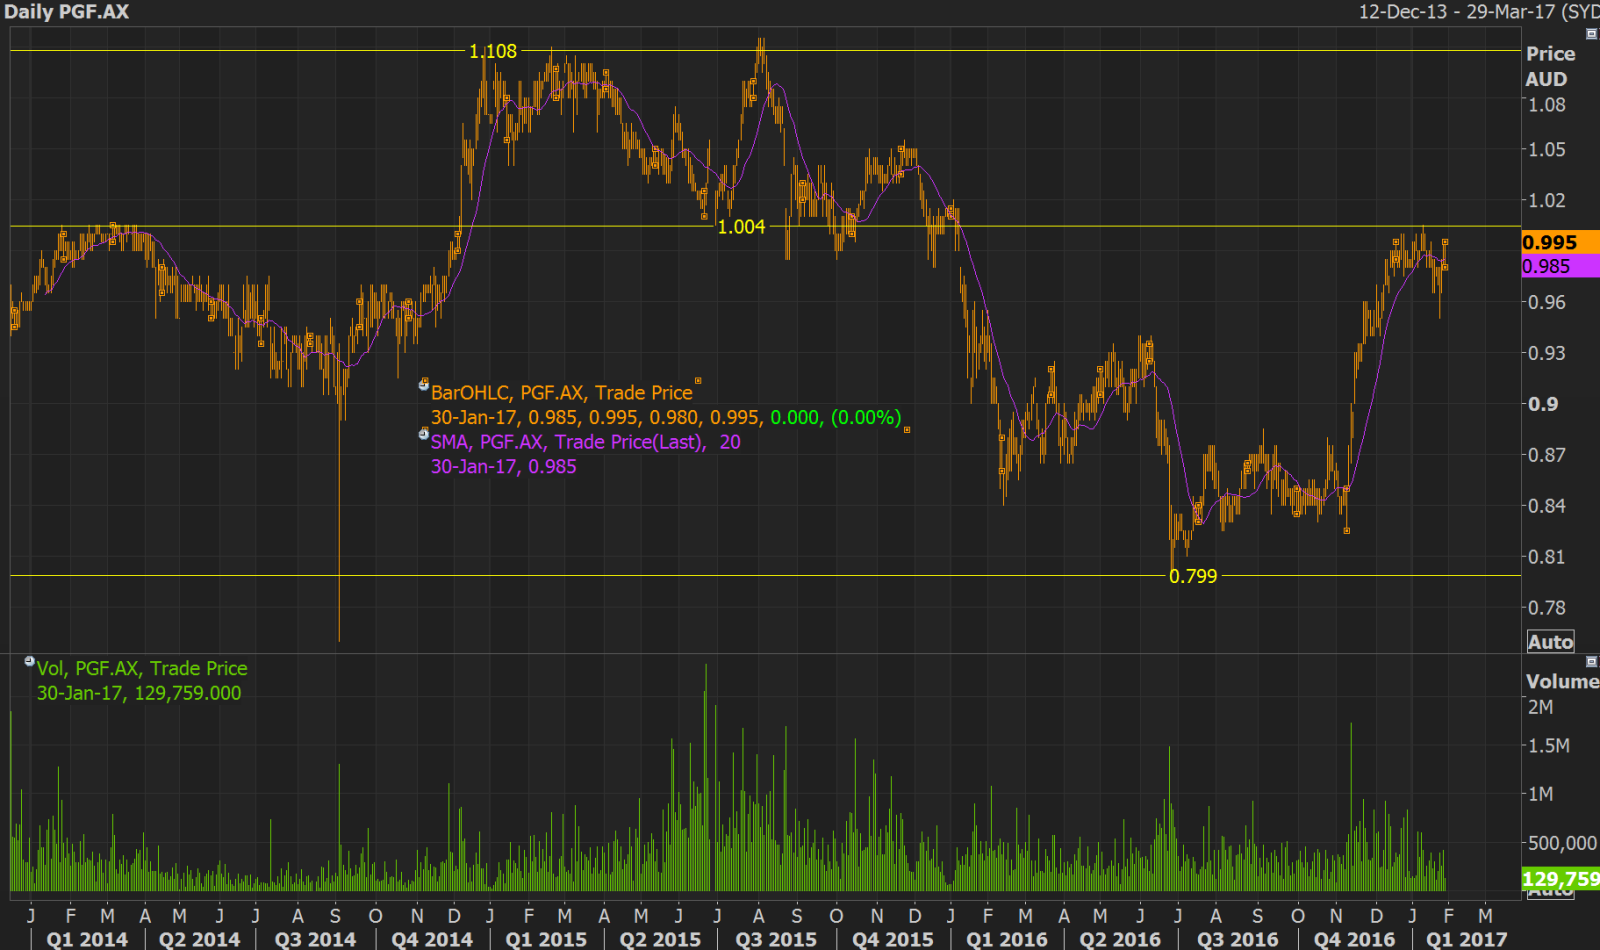
PGF Daily Chart (Source: Thomson Reuters)
Disclaimer
The advice given by Kalkine Pty Ltd and provided on this website is general information only and it does not take into account your investment objectives, financial situation or needs. You should therefore consider whether the advice is appropriate to your investment objectives, financial situation and needs before acting upon it. You should seek advice from a financial adviser, stockbroker or other professional (including taxation and legal advice) as necessary before acting on any advice. Not all investments are appropriate for all people. Kalkine.com.au and associated pages are published by Kalkine Pty Ltd ABN 34 154 808 312 (Australian Financial Services License Number 425376). The information on this website has been prepared from a wide variety of sources, which Kalkine Pty Ltd, to the best of its knowledge and belief, considers accurate. You should make your own enquiries about any investments and we strongly suggest you seek advice before acting upon any recommendation. Kalkine Pty Ltd has made every effort to ensure the reliability of information contained in its newsletters and websites. All information represents our views at the date of publication and may change without notice. To the extent permitted by law, Kalkine Pty Ltd excludes all liability for any loss or damage arising from the use of this website and any information published (including any indirect or consequential loss, any data loss or data corruption). If the law prohibits this exclusion, Kalkine Pty Ltd hereby limits its liability, to the extent permitted by law to the resupply of services. There may be a product disclosure statement or other offer document for the securities and financial products we write about in Kalkine Reports. You should obtain a copy of the product disclosure statement or offer document before making any decision about whether to acquire the security or product. The link to our Terms & Conditions has been provided please go through them and also have a read of the Financial Services Guide. On the date of publishing this report (mentioned on the website), employees and/or associates of Kalkine Pty Ltd currently hold positions in: BHP, BKY, KCN, PDN, and RIO. These stocks can change any time and readers of the reports should not consider these stocks as advice or recommendations.
 AU
AU

 Please wait processing your request...