Microsoft Corporation
.png)
MSFT Details
Strong Growth from Commercial Cloud Led the Improved Business Prospects:Microsoft Corporation (NASDAQ: MSFT) is an information technology company, which provides digital transformation within the intelligent cloud and an intelligent edge segment. On 26th February 2020, the company informed about the expected impact on the Chinese operations due to the outbreak of coronavirus.
Q2FY20 Business Highlights for the Period ended 31 December 2019: MSFT came up with its quarterly results, wherein the company reported total revenue of $36,906 million, up 14% on y-o-y basis. The above growth is aided by robust growth from the Commercial Cloud segment due to the strong execution from the sales teams and its business partners. The company reported its operating income at $13,891 million, up 35% on pcp terms. The quarter witnessed 30% revenue surge within the server products and cloud services segment driven by 62% y-o-y growth in the Azure revenue. Office Commercial products and cloud services revenue depicted a growth of 16% on y-o-y basis, driven by 27% revenue growth of Office 365. Revenue from LinkedIn increased 24% on y-o-y basis. The business reported higher research and development expense, up 13% y-o-y to $4,603 million, due to investments in cloud engineering, LinkedIn, and Gaming. On a GAAP basis, the company reported net income of $11,649 million, up 38% on y-o-y basis.
.png)
Key Q2FY20 Income Statement Highlights (Source: Company Reports)
Guidance: As per the earlier Q3FY20 guidance, the company anticipated revenue within the range of $10.75 billion to $11.15 billion from its More Personal Computing segment. However, with the recent update, the company highlighted that the sales from the above segment are likely to fall lower than the guidance due to the uncertainty related to the public health situation in China.
Valuation Methodology: Price to Earnings Based Valuation
.png)
Price to Earnings Based Valuation (Source: Thomson Reuters)
Note: All the forecasted figures are taken from Thomson Reuters, NTM: Next Twelve Months
Stock Recommendation:The stock of MSFT closed at $162.01. The stock made a 52-week low and high of $108.80 and $190.70 and is currently trading at the upper band of its 52-week trading range. The stock has delivered positive returns of 3.84% and 14.52% in the last three months and six-months, respectively.The company is focusing on innovating its product line and intends to provide unique experiences to its customers. Considering the aforesaid facts, current trading levels and business prospects, we have valued the stock using price to earnings based relative valuation method. For this, we have considered peers like Salesforce.Com Inc (NYSE: CRM), Oracle Corp (NYSE: ORCL), Adobe Inc (NYSE: ADBE), etc., and arrived at a target price which is offering a higher single-digit upside (in % terms). Hence, we give a ‘Buy’ recommendation on the stock at the closing price of $162.01, up 2.42% as on 28th February 2020.
Apple Inc.
.png)
AAPL Details
Reported Strong Operating Cash Flow Aided by Higher Product Demand: Apple Inc. (NASDAQ: AAPL) is a leading manufacturer of mobile phones, personal computer, laptops and other electronic gadgets. The company also offers software platforms like iOS, macOS, watchOS and tvOS to its clients. The company recently informed that worldwide iPhone supply will be temporarily constrained as the manufacturing partner sites are located outside the Hubei province. The operations across China are ramping up at a slower pace than the company anticipated. Secondly, due to the closure of stores in China, demand of the products is likely to be lower within the region.
Q1FY20 Operating Highlights for the Period ended 28 December 2019: AAPL announced its quarterly results, wherein net sales stood at $91,819 million, up 9% on y-o-y basis, aided by 37% contribution from wearables, home and accessories segment. Total gross margin stood at $35,217 million, as compared to $32,031 million in Q1FY19, driven by a favorable service mix and higher leverage, which was partially offset by higher service expenses. Net income during the period came in at $22,236 million, as compared to $19,965 million in Q1FY19. The business reported a strong operating cash flow of $30.5 billion, as compared to $26.7 billion in pcp.
.png)
Q2FY20 Key Income Statement Highlights (Source: Company Reports)
Valuation Methodology: Price to Cash Flow Based Valuation
.png)
Price to Cash Flow Based Valuation (Source: Thomson Reuters)
Note: All the forecasted figures are taken from Thomson Reuters, NTM: Next Twelve Months
Stock Recommendation:The stock of AAPL closed at $273.36 with a market capitalization of $1.19 trillion. The stock made a 52-week low and high of $169.5 and $327.85 and is currently trading at the upper band of its 52-week trading range. The stock has delivered positive returns of 2.12% and 30.86% in the last three months and six-months, respectively.Outside China, demand for Apple products and services are likely to remain strong and is expected to come in line with the company’s guidance. Considering the aforesaid facts, current trading levels and business prospects, we have valued the stock using Price to Cash Flow relative valuation method and arrived at a target price with a lower double-digit upside (in % terms). Hence, we give a ‘Buy’ recommendation on the stock at the closing price of $273.36, down 0.06% as on 28th February 2020.
Alphabet Inc.
.png)
GOOGL Details
Demand from Increasing Mobile Users Aid Top-line Growth: Alphabet Inc. (NASDAQ: GOOGL) offers products and services like Search engines, Maps, Ads, Gmail, Android, Chrome, Google Cloud and YouTube which are used globally.
FY19 Business Highlights for the Period ended 31 December 2019: GOOGL announced its full-year results, wherein the company reported $162 billion in revenue, up 18%, driven by increases in search queries resulting from increase in user adoption and usage, predominantly on mobile devices and ongoing growth in advertiser activity. YouTube ads revenues reported an increase of $3,994 million in FY19. The year was marked by the highest contributions from direct response and brand advertising products, driven by the improvements to ad formats and delivery and increased advertiser spending. The business reported its R&D expenses at $26,018 million, up from $21,419 million in FY18. This was primarily due to an increase in compensation expenses and facilities-related costs of $3,519 million, majorly driven by a 23% increase in headcount. Net income during FY19 stood at $34,343 million, as compared to $30,736 million in FY18.
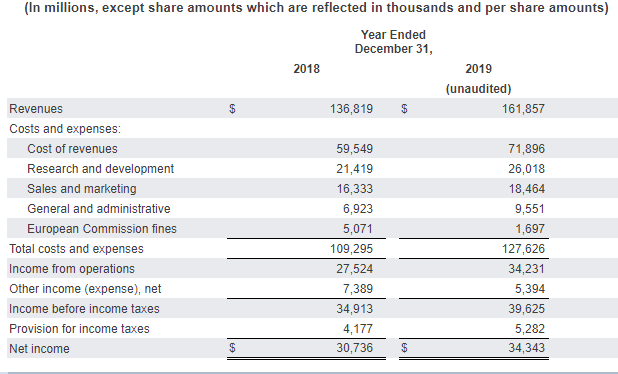
Key FY19 Income Statement Highlights (Source: Company Reports)
Valuation Methodology: Price to Earnings Based Valuation
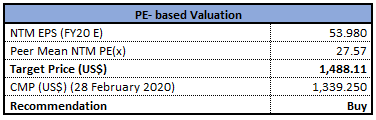
Price to Earnings Based Valuation (Source: Thomson Reuters)
Note: All forecasted figures and peers have been taken from Thomson Reuters, NTM-Next Twelve Months
Stock Recommendation:The stock of Google closed at $1339.25 with a market capitalization of $920.44 billion. The stock made a 52-week low and high of $1,027.03 and $1530.74 and is currently trading at the upper band of its 52-week trading range. The company has investments in deep computer science, including artificial intelligence, ambient computing and cloud computing, provide a strong base for continued growth and new opportunities. Considering the aforesaid facts, current trading levels and business prospects, we have valued the stock using Price to Earnings based relative valuation method and for the purpose, have taken the peer group - Facebook Inc (NYSE: FB), eBay Inc (NYSE: EBAY), Netflix Inc (NYSE: NFLX), etc. We have arrived at a target price which is offering a lower double-digit upside (in % terms). Hence, we give a ‘Buy’ recommendation on the stock at the closing price of $1339.25, up 1.85% as on 28th February 2020.
Amazon.Com, Inc.
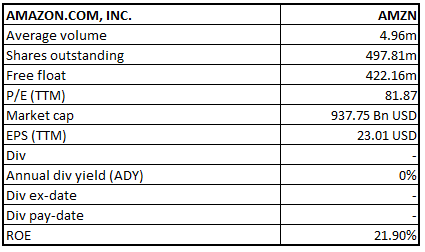
AMZN Details
New Product Launches to Drive Business Growth:Amazon.Com, Inc. (NASDAQ: AMZN) operates in the e-commerce segment and provides several cloud-based products likeAWS, Kindle Direct Publishing, Kindle, Fire tablets, Fire TV, Amazon Echo, Alexa, etc.
FY19 Business Highlights for the Period ended 31st December 2019: AMZN declared its full year results, wherein the company reported revenue of $280.5 billion, up 20% on y-o-y basis, aided by robust revenue growth from the North America segment. The company reported operating income of $14.5 billion, as compared to $12.4 billion in FY18.Net income stood at $11.6 billion, as compared to 10.1 billion in the previous financial year. The business reported decent growth in prime membership, which now has over 150 million registered members. The Fire TV segment reported more than 40 million of active users across the globe. During the period, the company launched new Fire TV Edition at CES 2020 which includes updated tools, features, and services for operators, device makers, and developers. Amazon launched several new products and services designed for kids, including the all-new Fire HD 10 Kids Edition, Kindle Kids Edition, Echo Glow etc.
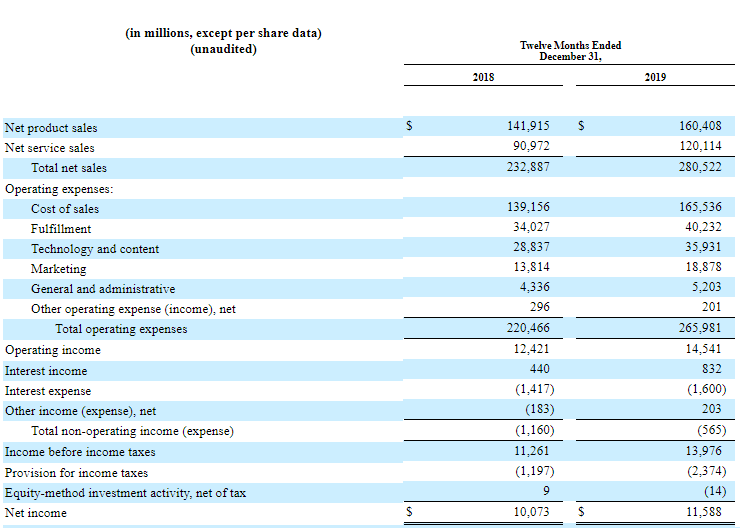
Key FY19 Financial Highlights (Source: Company Reports)
Guidance: As per the Q1FY20 guidance, the company expects net sales within the range of $69.0 billion to $73.0 billion, depicting a growth of 16% to 22% on Q1FY19. The company expects its operating income within the range of $3.0 billion and $4.2 billion, including an approximate reduction of $800 million in depreciation expense.
Valuation Methodology: EV/EBITDA Based Valuation
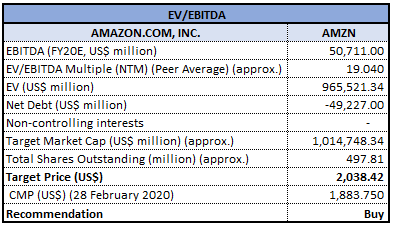
EV/EBITDA Based Valuation (Source: Thomson Reuters)
Note: All forecasted figures and peers have been taken from Thomson Reuters, NTM-Next Twelve Months
Stock Recommendation:The stock of AMZN closed at $1883.75 with a market capitalization of $937.75 billion. The stock made a 52-week low and high of $1,586.57 and $2185.95 and is currently trading close to the average of its 52-week trading range. The period was marked by decent top-line and bottom-line growth. With new product launches, the company is focusing to improve its market share in the coming years. Considering the aforesaid facts, current trading levels and business prospects, we have valued the stock using Enterprise Value to EBITDA based relative valuation method. For this, we have considered peers like Etsy Inc (NYSE: ETSY), Walmart Inc (NYSE: WMT) and Alibaba Group Holding Ltd (NYSE: BABA), etc. We have arrived at a target price which is offering a higher single-digit upside (in % terms). Hence, we give a ‘Buy’ recommendation on the stock at the closing price of $1883.75, down 0.03% as on 28th February 2020.
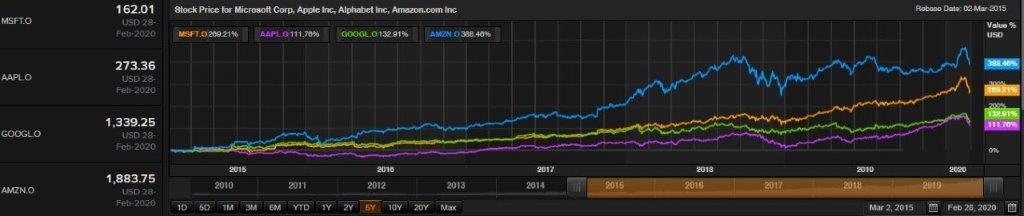
Comparative Price Chart (Source: Thomson Reuters)
Disclaimer
The advice given by Kalkine Pty Ltd and provided on this website is general information only and it does not take into account your investment objectives, financial situation or needs. You should therefore consider whether the advice is appropriate to your investment objectives, financial situation and needs before acting upon it. You should seek advice from a financial adviser, stockbroker or other professional (including taxation and legal advice) as necessary before acting on any advice. Not all investments are appropriate for all people. Kalkine.com.au and associated pages are published by Kalkine Pty Ltd ABN 34 154 808 312 (Australian Financial Services License Number 425376). The information on this website has been prepared from a wide variety of sources, which Kalkine Pty Ltd, to the best of its knowledge and belief, considers accurate. You should make your own enquiries about any investments and we strongly suggest you seek advice before acting upon any recommendation. Kalkine Pty Ltd has made every effort to ensure the reliability of information contained in its newsletters and websites. All information represents our views at the date of publication and may change without notice. To the extent permitted by law, Kalkine Pty Ltd excludes all liability for any loss or damage arising from the use of this website and any information published (including any indirect or consequential loss, any data loss or data corruption). If the law prohibits this exclusion, Kalkine Pty Ltd hereby limits its liability, to the extent permitted by law to the resupply of services. There may be a product disclosure statement or other offer document for the securities and financial products we write about in Kalkine Reports. You should obtain a copy of the product disclosure statement or offer document before making any decision about whether to acquire the security or product. The link to our Terms & Conditions has been provided please go through them and also have a read of the Financial Services Guide. On the date of publishing this report (mentioned on the website), employees and/or associates of Kalkine Pty Ltd do not hold positions in any of the stocks covered on the website. These stocks can change any time and readers of the reports should not consider these stocks as advice or recommendations.
 AU
AU

 Please wait processing your request...