Bloom Energy Corporation
BE Details
Founded in 2001, Bloom Energy Corporation (NASDAQ: BE) created the first large-scale, commercially feasible solid oxide fuel-cell-based power generation platform that offers clean and resilient power to businesses, essential services, and critical infrastructure.
Result Performance – For the first quarter ended 31 March 2021
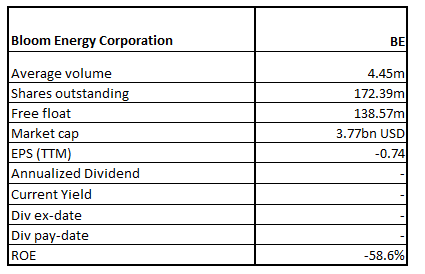
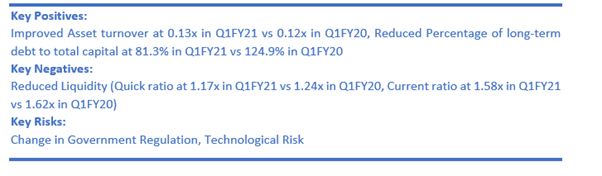
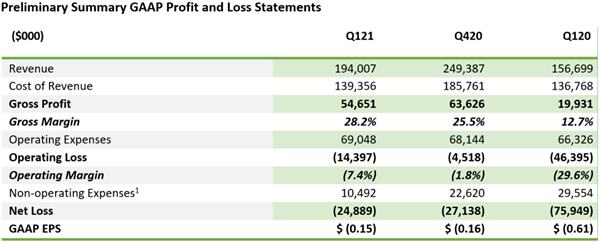
For the first quarter ended 31 March 2021, revenue of the company stood at $194.0 million, up 23.8% YoY led by a $38.4 million rise in product revenue and $11.3 million rise in service revenue which was partially offset by a $14.0 million fall in installation revenue. Further, GAAP gross margin in Q1FY21 was 28.2%, up 15.5 percentage points versus 12.7% in Q1FY20, whereas the non-GAAP gross margin in Q1FY21 was 29.7%, up 13.5 percentage points versus 16.2% in Q1FY20. The rise in gross margin was broadly led by higher product and service margins. The period witnessed 359 acceptances, or 35.9M, up 40.2% YoY. Importantly, the cash position, including restricted cash, stood at $365.7 million and $522.2 million of debt as of 31 March 2021.

Key Data (Source: Company Reports)
Recent Updates
- As per the release dated 18 May 2021, the company announced an agreement with Idaho National Laboratory to independently check the use of nuclear energy to create clean hydrogen via Bloom Energy’s solid oxide, high temperature electrolyzer.
Key Risks
The company is exposed to global economic conditions and uncertainties in the geopolitical environment where it operates. Further, its financial performance is susceptible to upfront costs for the energy servers, manufacturing defects risk, lengthy sales, and installation cycle of the products, among others.
Outlook
The company is seeing strong growth in the product revenue that jumped by 38.5% YoY in Q1FY21 led by the 40.2% rise in product acceptances supported by the expansion of the Community Distributed Generation program. This staggering growth in product revenue indicates greater acceptance of the company’s products. The sales momentum built during the quarter period is likely to drive the sales for the rest of the FY21.
In the meanwhile, the company has released its 2021 guidance. The revenue is expected to be in the ambit of $950 million to $1 billion with a non-GAAP gross margin at ~25% and a non-GAAP operating margin at ~3%, and importantly, it is expecting positive cash flow from operations.
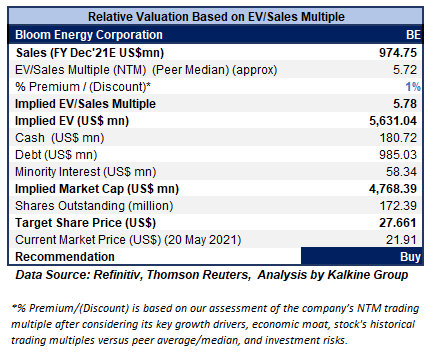
Valuation Methodology: EV/Sales Based Relative Valuation (Illustrative)
Technical Overview:
Weekly Chart –
Source: Refinitiv (Thomson Reuters)
Note: Purple colour lines are Bollinger Bands® with the upper band suggesting overbought status while the lower band oversold status, and yellow lines are Fibonacci retracement lines which measure price rebound and backtrack. https://www.bollingerbands.com/
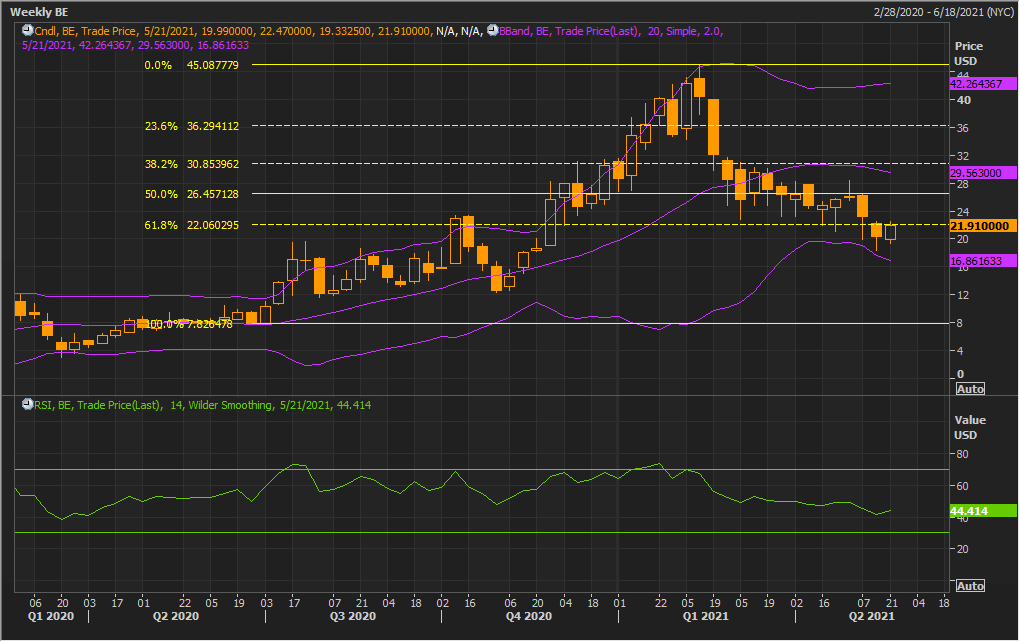
After two consecutive weeks of sell-off, the stock has given a stronger close for the ongoing week at $21.91 having covered all the losses it incurred in the previous week. The technical indicator RSI with a reading around 44 and a curve at the end pointing up, suggests neutral to up momentum for the stock.
Going forward, the stock may have resistance around a 50% retracement level of $26.45 whereas support could be around the lower Bollinger band of $16.86.
Stock Recommendation
The stock rose by ~33.9% in 9 months by ~16.7% in 6 months. It has made a 52-week low and high of $7.6400 and $44.95, respectively.
We have valued the stock using an EV/Sales multiple-based illustrative relative valuation and have arrived at a target price that reflects a rise of low double-digit (in % terms). We have assigned a slight premium to EV/Sales Multiple (NTM) (Peer Median) considering product sales backlog that stood at $1.0 billion, equivalent to 1,994 systems, or 199.4MW, as of 31 December 2020 indicating revenue visibility in 2021. Also, in November 2020, it won a contract in the Republic of Korea, with SK E&C to supply 1.8MW of hydrogen-powered fuel cells through a multi-stage deployment from late 2021 into 2022.
Considering recurring revenue stream with 100% product attach rate, yearly profitability expected in 2021, scalability, and cost-out to drive to 20% target service gross margin by 2025, we give a “Buy” recommendation on the stock at the current market price of $21.91 per share, up by 4.88% on 20th May 2021.
Plug Power, Inc.

PLUG Details
Plug Power, Inc. (NASDAQ: PLUG) is a provider of hydrogen fuel cell turnkey solutions which is used to power electric motors. The company has a market capitalization of ~US$14.7 billion as on 18th May 2021.
Result Update – For the Year Ended 31 December 2020 – (FY20)
As per the release dated 14 May 2021, the company completed the restatement of its earlier issued financial statements FY18 and FY19 and its quarterly filings for FY19 & FY20 and has filed its Form 10-K for FY20.
On 31 December 2020, PLUG waived the remaining vesting conditions under the Amazon Warrant that impacted a fall in revenue of $399.7 million, which resulted in negative revenue of $93.2 million for FY20. Meanwhile, the Company continued to realize negative cash flows from operations and net losses. PLUG reported net losses attributable to common stockholders of $596.2 million in FY20 versus $85.6 million in FY19. In line with this, cash used in operations totalled $155.5 million for FY20 and has an accumulated deficit of $1.9 billion at December 31, 2020.
Key Data (Source: Company Reports)
Risks
The company is constantly entering into JVs and partnerships to expand further, which may impact the overall profitability, under unfavourable business circumstances. Further, for production, PLUG is dependent on the accessibility and supply of hydrogen gas and third-party sourcing of key components, lower commodity prices, and smooth supply chain management, among others. Any significant deviation to the planned production line will have a negative impact on operations and financial performance of the company.
Outlook:
The company anticipates its Q2FY21 gross billings to surpass $105 million, ~50% rise from Q2FY20, and forecasts to report over $102 million of net revenue, ~50% growth from Q2FY20. In addition, the company retains a robust balance sheet with over $5 billion of cash to fuel future growth initiatives. Importantly, the company continues to forecast its annual gross billings targets of $475 million in 2021, $750 million in 2022 and $1.7 billion in 2024.
Valuation Methodology: EV/Sales Multiple Based Relative Valuation (Illustrative)

Technical Overview:
Weekly Chart –
Source: Refinitiv (Thomson Reuters)
Note: Purple colour lines are Bollinger Bands® with the upper band suggesting overbought status while the lower band oversold status, and yellow lines are Fibonacci retracement lines which measure price rebound and backtrack. https://www.bollingerbands.com/
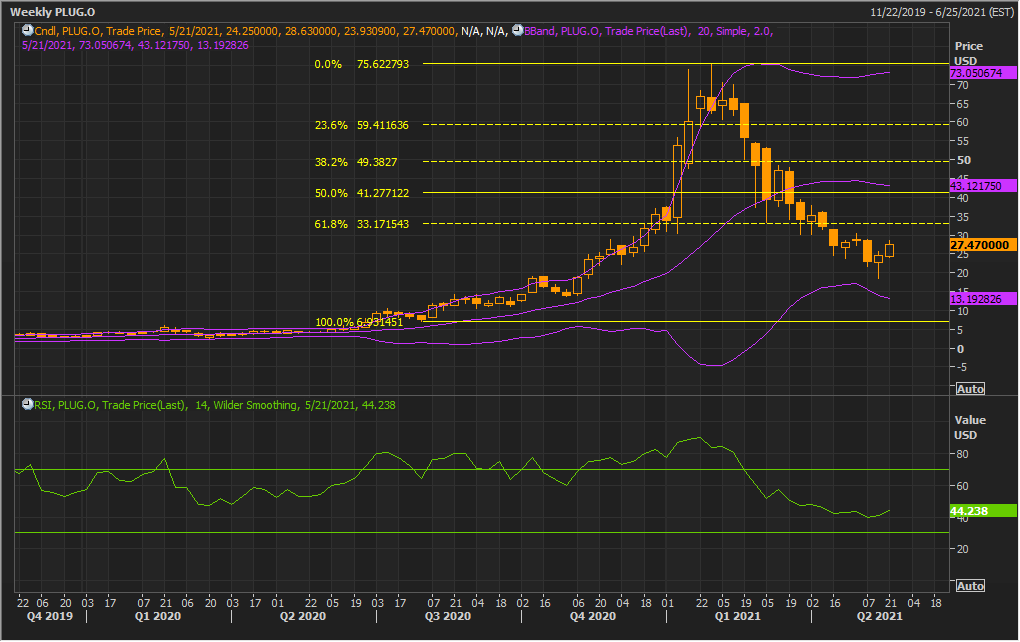
The stock gave bullish reversal signal having formed a ‘Hammer’ pattern in the previous week. It has given a stronger closing at $27.47 for the ongoing week thereby exhibiting strength in bullish trend reversal. The technical indicator RSI with a reading around 44 and a curve at the end pointing up suggests gaining of bullish momentum for the stock.
Going forward, the stock may have resistance around the 50.0% retracement level of $41.27 whereas support could be around $20.00.
Stock Recommendation:
The stock rose by ~100.95% in 9 months. It has made a 52-week low and high of $4.03 and $75.49, respectively.
We have valued the stock using EV/Sales multiple-based illustrative relative valuation method and have arrived at a target price of low double digit-upside. We applied a discount to the peer average EV/Sales (NTM Trading multiple) considering negative ROE and ROIC.
Driven by the optimism by the management, current trading levels, and positive long-term outlook, we recommend a ‘Buy’ rating on the stock at the current market price of $27.470 per share on 20th May 2021.
Note: Investment decisions should be made depending on the investors’ appetite on upside potential, risks, holding duration, and any previous holdings. Investors can consider exiting from the stock if the Target Price mentioned as per the Valuation has been achieved and subject to the factors discussed above.
Disclaimer - This report has been issued by Kalkine Pty Limited (ABN 34 154 808 312) (Australian financial services licence number 425376) (“Kalkine”) and prepared by Kalkine and its related bodies corporate authorised to provide general financial product advice. Kalkine.com.au and associated pages are published by Kalkine.
Any advice provided in this report is general advice only and does not take into account your objectives, financial situation or needs. You should therefore consider whether the advice is appropriate to your objectives, financial situation and needs before acting upon it.
There may be a Product Disclosure Statement, Information Statement or other offer document for the securities or other financial products referred to in Kalkine reports. You should obtain a copy of the relevant Product Disclosure Statement, Information Statement or offer document and consider the statement or document before making any decision about whether to acquire the security or product.
You should also seek advice from a financial adviser, stockbroker or other professional (including taxation and legal advice) as necessary before acting on any advice in this report or on the Kalkine website. Not all investments are appropriate for all people.
The information in this report and on the Kalkine website has been prepared from a wide variety of sources, which Kalkine, to the best of its knowledge and belief, considers accurate. Kalkine has made every effort to ensure the reliability of information contained in its reports, newsletters and websites. All information represents our views at the date of publication and may change without notice.
Kalkine does not guarantee the performance of, or returns on, any investment. To the extent permitted by law, Kalkine excludes all liability for any loss or damage arising from the use of this report, the Kalkine website and any information published on the Kalkine website (including any indirect or consequential loss, any data loss or data corruption). If the law prohibits this exclusion, Kalkine hereby limits its liability, to the extent permitted by law, to the resupply of services.
Please also read our Terms & Conditions and Financial Services Guide for further information.
On the date of publishing this report (referred to on the Kalkine website), employees and/or associates of Kalkine do not hold interests in any of the securities or other financial products covered on the Kalkine website.
 AU
AU

 Please wait processing your request...