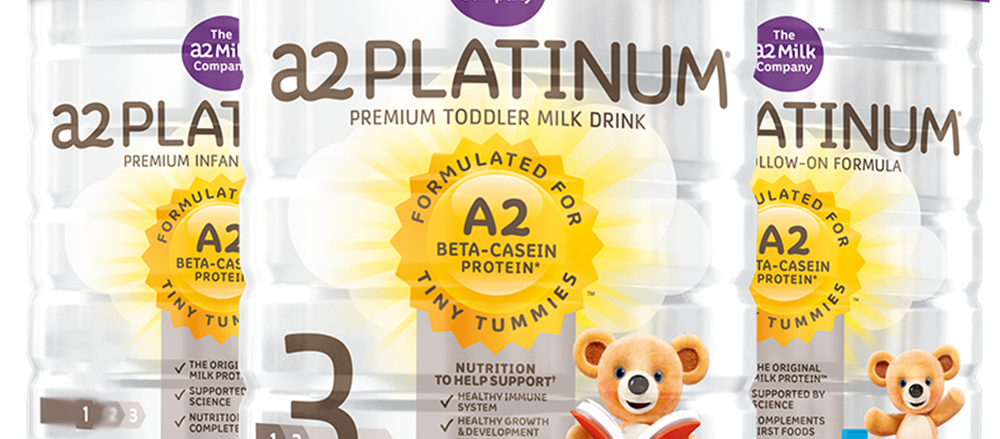
The A2 Milk Company Ltd
.png)
A2M Details
Increasing geographic expansion:The A2 Milk Company Ltd (ASX: A2M) in FY 16 has increased investment in marketing and brand development to 9.4% of net revenue which reflects the targeted increased spend in ANZ, China and USA. On the other hand, A2M has attributed to delays in achieving distribution in United States with a number of larger retailers, therefore there are concerns about the group’s growth in the United States as the progress is behind schedule.

FY 16 Geographic Financial Performance (Source: Company Reports)
However, A2M’s solid FY16 performance in China has ended concerns over the impact from changes to regulations in China.
The group is expected to provide an update on financial performance during its Annual Meeting in November 2016. Even though A2M stock rose over 24.6% in the last three months (as of September 13, 2016), we believe there is more upside left. Accordingly, we give a “Hold” recommendation on the stock at the current price of $1.86

A2M Daily Chart (Source: Thomson Reuters)
Bellamy’s Australia Ltd
.png)
BAL Details
Strong gross profit in FY 16: Bellamy's Australia Ltd (ASX: BAL) has reported an EBIT growth of 342% to $54.3m in FY 16, while the revenues grew 95% to $245 million. China’s segment delivered even better performance wherein revenues rose 331% while the NPAT grew by 326% to $38.3m. The EBIT margin has more than doubled from 10% in FY15 to 22% in FY16.
.png)
FY 16 Financial Performance (Source: Company Reports)
Moreover, BAL is working on cost management driven by the growth in the business infrastructure as the head count has increased by 50%.
BAL would increase the manufacturing volume for FY17 which would drive inventory build for growth in existing and new markets. Meanwhile, BAL stock rose over 22.3% in the last six months (as of September 13, 2016), and we maintain a “Hold” recommendation on the stock at the current price of $12.75

BAL Daily Chart (Source: Thomson Reuters)
Baby Bunting Group Ltd
.png)
BBN Details
Comparable store sales growth to fall to the mid-single digit in FY 2017: Baby Bunting Group Ltd (ASX: BBN) has reported a 31.4% growth in the total sales to $236.8 million and pro forma EBITDA growth of 51.1% to $18.7 million in FY 16 as compared to the FY 15. BBN has exceeded the FY16 prospectus forecasts. Moreover, opening of five new stores and the roll out of new initiatives in FY16 helped in driving the comparable store sales that grew 12.5%. BBN has planned four to eight new store openings in FY 17. Four new store leases have been signed and the stores are expected to be open before February 2017. BBN’s Pro forma net profit after tax (NPAT) grew 55.8% of $10.6 million on the prior corresponding period. On the other hand, BBN in FY 17 is expecting EBITDA to be in the range of $21.5 million to $24.5 million, representing growth in the range of 15% to 31%. This excludes employee equity incentive expenses. The comparable store sales growth as at August 07, 2016 is 15% year to date, which is expected to moderate to be more in line with the long term historical average (mid-single digit). The group’s annual general meeting is to be held in November 2016. Moreover, BBN stock rose 26.2% in the last six months (as of September 13, 2016), placing the stock at a high P/E.
Even though BBN would be added to S&P/ASX 300 Index from September 16, 2016 after the market close, we give an “Expensive” recommendation on the stock at the current price of $2.95

BBN Daily Chart (Source: Thomson Reuters)
Monash IVF Group Ltd
.png)
MVF Details
Exceeded the upper range of guidance: Monash IVF Group Ltd (ASX: MVF) reported a 25.3% rise in the group revenues to $156.6m in FY 16 in which 10.7% is from organic growth and 14.6% is derived from acquisitions. Net profit after tax (NPAT) rose 34.6% to $28.8m. The FY16 NPAT has exceeded by 4.6% on the upper range of MVF’s guidance of delivering the NPAT growth of 25% to 30% on its FY15 NPAT performance.
In addition, MVF had acquired the Sydney Ultrasound for Women (SUFW) network in June 2015, which had contributed $17.7m in revenue growth and $4.0m EBITDA in FY16. On the other side, in June 2016, MVF has re-financed the syndicated debt facility with a new $110m term debt facility and $5m working capital facility. Additionally, a $40m accordion facility is available for the strategic growth opportunities. We give a “Hold” recommendation on the stock at the current price of $2.27

MVF Daily Chart (Source: Thomson Reuters)
G8 Education Ltd
.png)
GEM Details
Well positioned to leverage the market opportunity: G8 Education Ltd (ASX: GEM) deals with early education where Australia has recently lifted levels of investment in early childhood education. GEM stock fell over 17.9% in the last four weeks (as of September 13, 2016), due to concerns related to the government funding to the group (government funding was said to represent about 50% of GEM's revenue). But we believe GEM is still well positioned to grow its business and for 1H 2016 they reported a 16.2% growth in the revenue to $361.2m due to increase in the fees and acquisitions. GEM’s EBIT in 1H 2016 grew 8.5% due to improved performance in Q2.
The demand for childcare services in Australia has been growing and the legislation might increase funding by AUD 3.2 billion over four years from 2018. We maintain a “Buy” recommendation on the stock at the current price of $3.03
.PNG)
GEM Daily Chart (Source: Thomson Reuters)
Virtus Health Ltd
.png)
VRT Details
Strong international operational growth: Virtus Health Ltd.’s (ASX: VRT) international operations have reported segment EBITDA growth of 138% to $5.7m in FY 16 as the Singapore clinic reduced loss. Moreover, VRT has reported an 11.6% growth in the revenue to $261.2m while the NPAT grew 14.5% to $34.8m on prior corresponding period (pcp) mainly due to the growth from its international operations.
.png)
Diversified Revenue Mix (Source: Company Reports)
VRT is the market leader in Australia and Ireland and is growing its presence in Singapore, UK and Europe. Even though VRT stock rose 28.4% in the last six months (as of September 13, 2016), we give a “Hold” recommendation on the stock at the current price of $7.71

VRT Daily Chart (Source: Thomson Reuters)
Blackmores Limited
.png)
BKL Details
First Quarter of 2017 is expected to be subdued: Blackmores Limited (ASX: BKL) reported a group sales growth of 52% to $717 million in FY 16 against the prior year while the net profit after tax (NPAT) reached $100 million, which is 115% up against the prior year.
Moreover, the first quarter of 2017 is expected to be subdued due to volatile Australian wholesale market which has softened in recent weeks impacted by retailers destocking and some exporters changing the channels through which they acquire products. BKL stock fell over 46.14% during this year to date (as of September 13, 2016). We believe that the stock is still “Expensive” at the current price of $116

BKL Daily Chart (Source: Thomson Reuters)
Disclaimer
The advice given by Kalkine Pty Ltd and provided on this website is general information only and it does not take into account your investment objectives, financial situation or needs. You should therefore consider whether the advice is appropriate to your investment objectives, financial situation and needs before acting upon it. You should seek advice from a financial adviser, stockbroker or other professional (including taxation and legal advice) as necessary before acting on any advice. Not all investments are appropriate for all people. Kalkine.com.au and associated pages are published by Kalkine Pty Ltd ABN 34 154 808 312 (Australian Financial Services License Number 425376).The information on this website has been prepared from a wide variety of sources, which Kalkine Pty Ltd, to the best of its knowledge and belief, considers accurate. You should make your own enquiries about any investments and we strongly suggest you seek advice before acting upon any recommendation. Kalkine Pty Ltd has made every effort to ensure the reliability of information contained in its newsletters and websites. All information represents our views at the date of publication and may change without notice. To the extent permitted by law, Kalkine Pty Ltd excludes all liability for any loss or damage arising from the use of this website and any information published (including any indirect or consequential loss, any data loss or data corruption). If the law prohibits this exclusion, Kalkine Pty Ltd hereby limits its liability, to the extent permitted by law to the resupply of services. There may be a product disclosure statement or other offer document for the securities and financial products we write about in Kalkine Reports. You should obtain a copy of the product disclosure statement or offer document before making any decision about whether to acquire the security or product. The link to our Terms & Conditions has been provided please go through them and also have a read of the Financial Services Guide. On the date of publishing this report (mentioned on the website), employees and/or associates of Kalkine Pty Ltd currently hold positions in: BHP, BKY, KCN, PDN, and RIO. These stocks can change any time and readers of the reports should not consider these stocks as advice or recommendations.
 AU
AU
 Please wait processing your request...