SanDisk Corporation
SanDisk Corporation (NASDAQ: SNDK) is a global provider of NAND flash-based data storage solutions, offering a broad portfolio that includes solid-state drives (SSDs), embedded storage, removable cards, USB drives, and memory components. The company serves diverse end markets—cloud (enterprise and data center), client (PCs, gaming, and embedded devices), and consumer (retail storage products)—leveraging its technology to support data storage needs across both commercial and individual applications.

Key Growth Aspects
- Robust Revenue Expansion Driven by End-Market Strength: Sandisk delivered a substantial improvement in revenue performance, supported by strong demand across all major end markets. Net revenue increased to approximately USD 3,025 million in Q2 FY26 compared with USD 1,876 million in Q2 FY25, reflecting broad-based growth across datacenter, edge, and consumer segments. The expansion was particularly notable in AI-driven infrastructure demand and improving storage content per device, reinforcing the company’s positioning in high-growth digital ecosystems.
- Significant Margin Expansion and Profitability Upside: The company demonstrated a sharp improvement in profitability, with gross profit rising to USD 1,541 million from USD 606 million in the prior-year quarter. This translated into a material expansion in gross margins, supported by favorable pricing trends, including a mid-30% increase in ASP per gigabyte. Operating income also increased significantly to USD 1,065 million, indicating improved cost absorption and operating leverage across the business.
- Strong Earnings Growth Reflecting Operating Leverage: Net income rose materially to USD 803 million in Q2 FY26 from USD 104 million in Q2 FY25, highlighting the company’s ability to convert revenue growth into bottom-line expansion. The improvement was driven by higher gross margins, controlled operating expenses, and favorable market conditions in NAND pricing. Earnings per share also increased significantly, underscoring enhanced shareholder value creation.
- Improved Cash Flow Generation and Balance Sheet Strengthening: Sandisk reported a notable improvement in operating cash flow, generating approximately USD 1,507 million in the first six months of FY26 compared with negative USD 36 million in the prior-year period. Additionally, the company reduced long-term debt significantly to USD 583 million from USD 1,829 million, strengthening its balance sheet and enhancing financial flexibility for future investments.
Growth Challenges
- Exposure to Pricing Volatility and Cyclical Demand: Despite strong current performance, the company remains highly exposed to cyclical pricing dynamics in the NAND flash market. Management highlighted volatility in average selling prices and demand fluctuations as key risks, indicating that the current margin expansion may not be sustainable in a downcycle or oversupply environment.
- Rising Cost Pressures and Continued Investment Requirements: Operating expenses increased to USD 476 million in Q2 FY26 from USD 411 million in Q2 FY25, driven by higher research and development investments and ongoing business separation costs. The company continues to invest heavily in next-generation technologies such as BiCS8, which, while strategically necessary, may pressure near-term margins and cash flows.
- High Customer Concentration and Revenue Dependence: The business remains concentrated among a limited number of customers, with the top 10 customers accounting for approximately 44% of revenue in Q2 FY26. Such concentration increases vulnerability to demand shifts, pricing negotiations, or consolidation among key customers, which could materially impact revenue stability.
- Ongoing Supply Chain and Strategic Dependency Risks: Sandisk’s operations rely significantly on strategic partnerships, particularly with Kioxia, and a limited supplier base for critical components. This dependency exposes the company to supply chain disruptions, operational constraints, and execution risks, especially in periods of strong demand where supply limitations may restrict growth potential.
Key Risks:
- Cyclical NAND Pricing Risk: Earnings remain highly sensitive to fluctuations in NAND flash pricing and demand cycles, which can materially impact margins and revenue visibility.
- Customer Concentration Exposure: A significant portion of revenue is derived from a limited number of large customers, increasing vulnerability to demand shifts or pricing pressure.
- Strategic Partnership Dependency: Reliance on joint ventures and partners such as Kioxia exposes the company to operational, supply chain, and execution risks.
- High Capital Intensity & Technology Transition Risk: Ongoing investments in advanced nodes (e.g., BiCS8) and capacity expansion may pressure cash flows and require sustained favorable market conditions.
Technical Observation (on the daily chart):
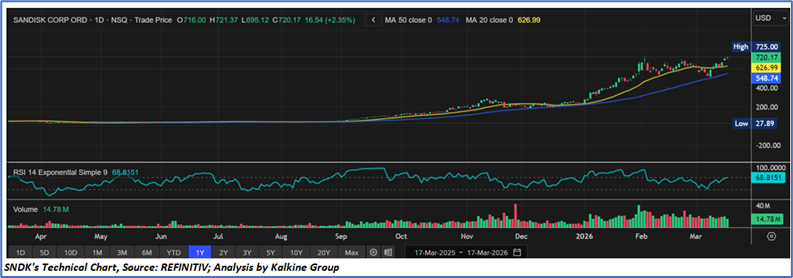
- The chart reflects a strong and sustained uptrend over the past year, characterized by consistent higher highs and higher lows. The stock has transitioned from a prolonged base into a sharp bullish breakout phase, indicating strong institutional accumulation and trend continuation.
- The price is trading well above both the 20-day (USD 626.99) and 50-day (USD 548.74) moving averages, with the shorter-term average positioned above the longer-term average. This positive alignment reinforces near-term momentum and suggests continued upward bias unless a breakdown below these levels occurs.
- The RSI is hovering around ~68, indicating strong momentum but not yet in deeply overbought territory (>70). This suggests there is still room for upside, although the stock is approaching levels where short-term consolidation or mild pullback could emerge.
- Recent upward price moves have been accompanied by elevated volume levels, confirming the strength of the breakout. Sustained participation indicates conviction among buyers, particularly during the rally seen from late January onwards.
Sandisk’s Q2 FY26 performance reflects a strong operational inflection, with robust revenue growth, significant margin expansion, and improved cash generation driven by favorable NAND pricing and AI-led demand across datacenter, edge, and consumer segments. However, the sustainability of this momentum remains contingent on inherently cyclical pricing dynamics, elevated capital intensity, and dependence on key customers and strategic partners, which collectively introduce variability in earnings visibility despite the current phase of strong profitability and balance sheet improvement.
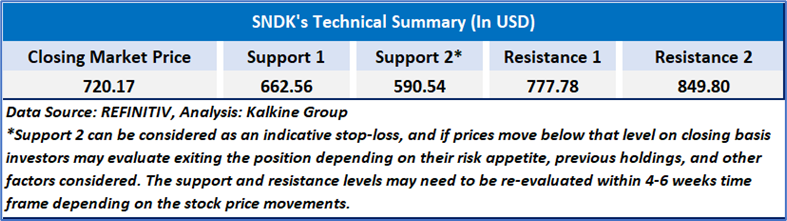
As per the above-mentioned price action, recent key business and financial updates, momentum in the stock over the last month, and technical indicators analysis, a ‘Watch’ rating has been SanDisk Corporation (NASDAQ: SNDK) at the closing market price of USD 720.17 as of March 17,2026.
Individuals can evaluate the stock based on the support and resistance levels provided in the report in case of keen interest taking into consideration the risk-reward scenario.
Markets are trading in a highly volatile zone currently due to certain macro-economic issues and prevailing geopolitical tensions. Therefore, it is prudent to follow a cautious approach while investing.
Related Risk: This report may be looked at from a high-risk perspective and a recommendation is provided for a short duration. This report is solely based on technical parameters, and the fundamental performance of the stocks has not been considered in the decision-making process. Other factors which could impact the stock prices include market risks, regulatory risks, interest rates risks, currency risks, social and political instability risks etc.
Note 1: Past performance is not a reliable indicator of future performance.
Note 2: The reference date for all price data, currency, technical indicators, support, and resistance level is March 16,2026. The reference data in this report has been partly sourced from REFINITIV.
Note 3: Investment decisions should be made depending on an individual's appetite for upside potential, risks, holding duration, and any previous holdings. An 'Exit' from the stock can be considered if the Target Price mentioned as per the Valuation and or the technical levels provided has been achieved and is subject to the factors discussed above.
Note 4: Target Price refers to a price level that the stock is expected to reach as per the relative valuation method and or technical analysis taking into consideration both short-term and long-term scenarios.
Note 5: ‘Kalkine reports are prepared based on the stock prices captured either from the New York Stock Exchange (NYSE), NASDAQ Capital Markets (NASDAQ), and or REFINITIV. Typically, all sources (NYSE, NASDAQ, or REFINITIV) may reflect stock prices with a delay which could be a lag of 15-20 minutes. There can be no assurance that future results or events will be consistent with the information provided in the report. The information is subject to change without any prior notice.

 CA
 NZ
 UK
 US
 IND

 AU

 Please wait processing your request...