This report is an updated version of the report published on 19 January 2026 at 12:30 PM AEDT.

Boss Energy Ltd (ASX: BOE)
Company Overview: Boss Energy Ltd (ASX: BOE) is engaged into uranium mining productions and operates world-class in-situ recovery (ISR) projects across Australia and the United States. The company’s flagship asset is the 100%-owned Honeymoon Uranium Project in South Australia, which employs low-cost, environmentally responsible ISR mining technology to supply uranium for the global nuclear energy market.
Recommendation Rationale – SELL at AUD 1.790
- Technical Standpoint: BOE’s share price has surpassed the R1 level of AUD 1.6764 recommended on 14 January 2025. Meanwhile, its 14-Day Relative Strength Index (RSI) is hovering around ~62.19 level, suggesting the stock is approaching overbought level. Hence, the stock may witness some consolidation.
- Honeymoon Project Update: On 18 December 2025, BOE released an update on its Honeymoon uranium project noting a typographical correction to FY26 guidance in an accompanying amendment. Delineation drilling revealed less continuous higher-grade mineralisation, pod-like lenses, reduced leachability near impermeable layers, and smaller wellfields under the prior design. Actual Honeymoon domain performance tracks early EFS recovery but expects 1.5-2.5 Mlbs less total output.
- Uranium Market Price Volatility: Fluctuations in uranium spot and term prices can materially impact revenue, cash flow, and inventory valuation given the company's strategic inventory position.
- Lower Operating Margin: BOE reported a negative 41.8% of operating margin in FY25, while industry median is 20.5%.
Daily Price Chart
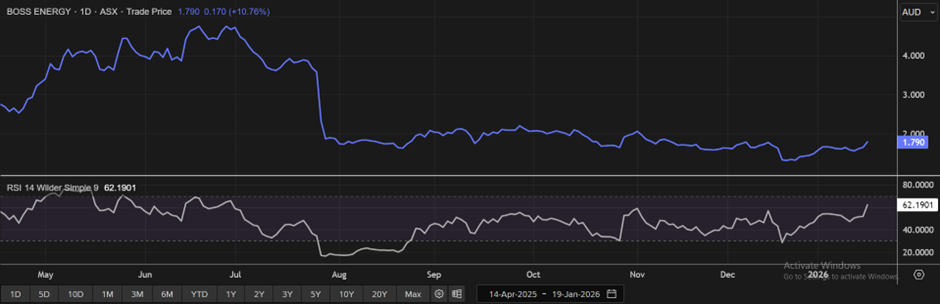
(Daily Technical Chart; Source: REFINITIV)
Valuation Methodology: Price/Cash Flow Approach (Illustrative)
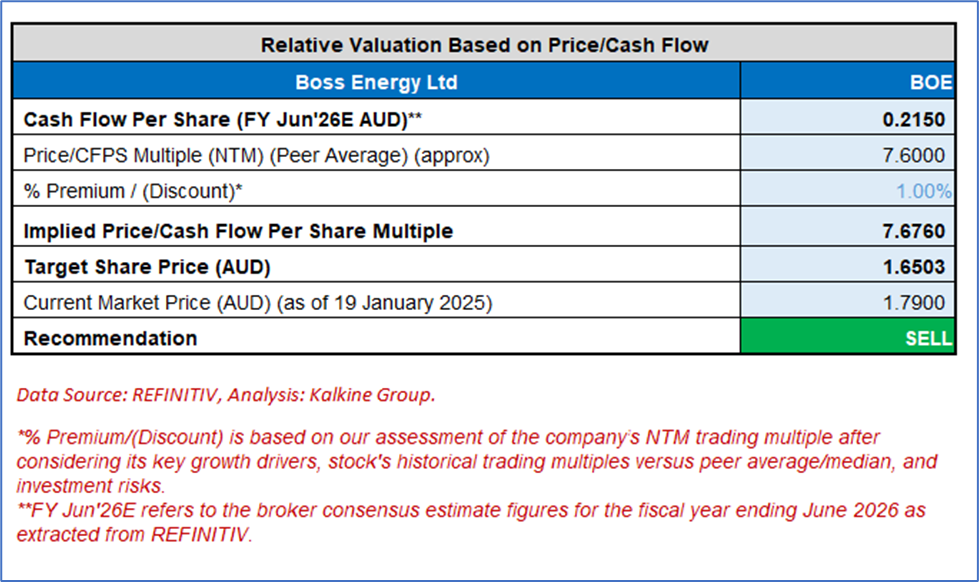
The stock might trade at a slight premium to its peers given the debt-free balance sheet, immediate cash flow positivity from Honeymoon ramp-up, and ISR (In-Situ Recovery) advantages (lower capex intensity versus conventional mining peers).
For conducting the valuation, following peers have been considered - Whitehaven Coal Ltd (ASX: WHC), Ampol Ltd (ASX: ALD), and Fortescue Ltd (ASX: FMG)
Given the stock has surpassed its R1 level, recent rally in the share price, and risks associated, it is prudent to sell the stock at the current levels. Hence, a ‘Sell’ recommendation is given on the stock at the current market price of AUD 1.790, as of 19 January 2026, at 12:05 PM AEDT.
Markets are trading in a highly volatile zone currently due to certain macro-economic issues and geopolitical issues prevailing geopolitical tensions. Therefore, it is prudent to follow a cautious approach while investing.
Note 1: Past performance is neither an indicator nor a guarantee of future performance.
Note 2: The reference date for all price data, currency, technical indicators, support, and resistance levels is 19 January 2026. The reference data in this report has been partly sourced from REFINITIV.
Note 3: Investment decisions should be made depending on an individual's appetite for upside potential, risks, holding duration, and any previous holdings. An 'Exit' from the stock can be considered if the Target Price mentioned as per the Valuation and or the technical levels provided has been achieved and is subject to the factors discussed above.
Note 4: Kalkine reports are prepared based on the stock prices captured either from REFINITIV or Trading View. Typically, REFINITIV or Trading View may reflect stock prices with a delay which could be a lag of 25-30 minutes. There can be no assurance that future results or events will be consistent with the information provided in the report. The information is subject to change without any prior notice.
Technical Indicators Defined: -
Support: A level at which the stock prices tend to find support if they are falling, and downtrend may take a pause backed by demand or buying interest.
Resistance: A level at which the stock prices tend to find resistance when they are rising, and uptrend may take a pause due to profit booking or selling interest.
Stop-loss: In general, it is a level to protect further losses in case of any unfavourable movement in the stock prices.

 CA
 NZ
 UK
 US
 IND

 AU

 Please wait processing your request...