NEXTDC Limited (ASX: NXT)
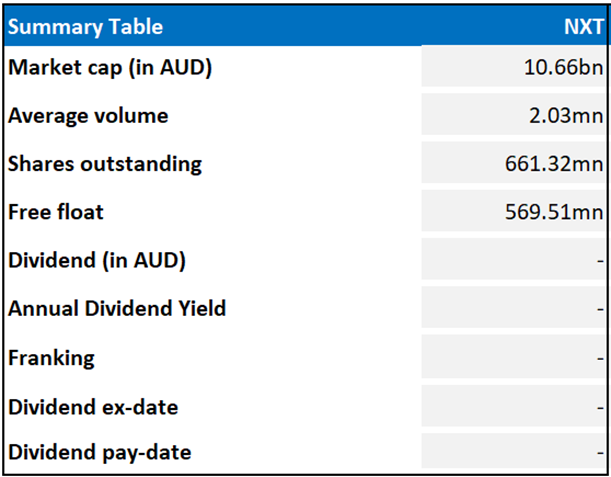
NEXTDC Limited (ASX: NXT) is a Data Centre-as-a-Service provider. The ASX-listed company is engaged in delivering critical power, security and connectivity for global cloud computing providers, enterprises, and government entities.
Recommendation Rationale – SELL at AUD 17.745
- Financial Performance: NXT registered a 31% YoY jump in total revenue, 5% YoY growth in underlying EBITDA, and 77% increase in contracted utilisation in 1HFY24. The period saw material customer wins and record customer demand. In the one-year period to 31 December 2023, the company registered a 77% YoY jump in contracted utilisation and a 13% increase in customer numbers.
- Outlook: In FY24, NXT expects total revenue to be in the range of AUD 400mn to AUD 415mn, with net revenue expected to range between AUD 296mn and AUD 304mn, reflecting a 6-9% YoY increase.
- Emerging Risks: NXT continues to make losses, owing to various factors such as high operational costs, significant initial investments in infrastructure, fluctuations in demand for data storage and cloud services, etc.
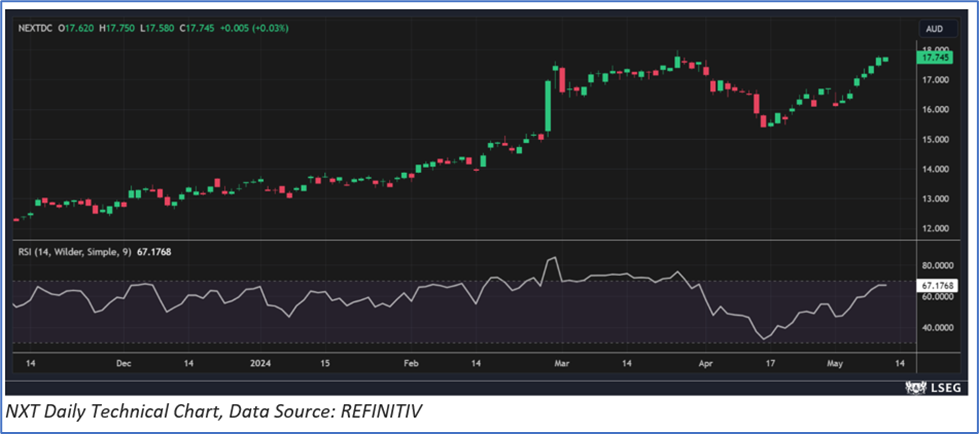
NXT Daily Chart

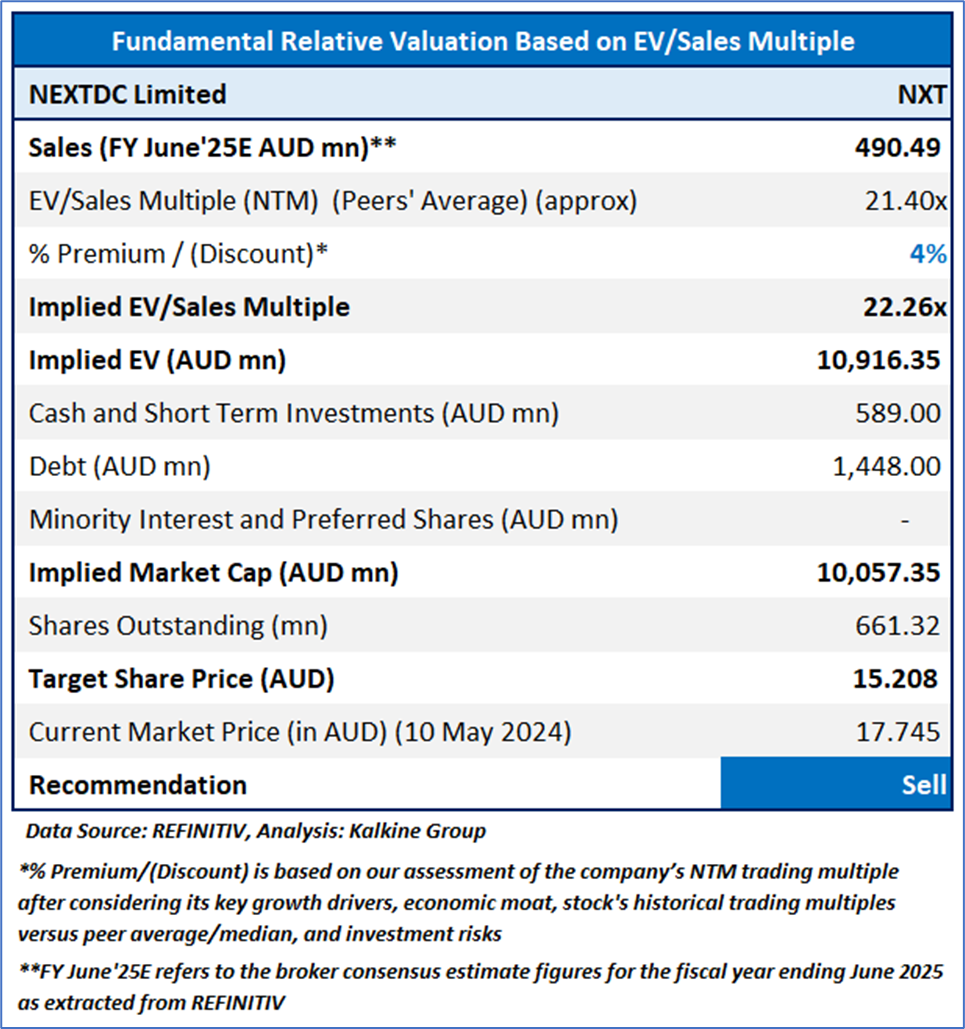
Valuation Methodology: EV/Sales Approach (FY June'25E) (Illustrative)

Stock might trade at some premium to its peers, considering the anticipated 6-9% year-over-year increase in net revenue in FY24, focus on making investments in data centre expansion, material customer wins and record customer demand, and other factors. For valuation, few peers like carsales.com Limited (ASX: CAR), WiseTech Global Ltd (ASX: WTC), and Altium Ltd (ASX: ALU) have been considered. Considering the current trading levels and risks associated, downside indicated by the valuation, it is prudent to book profit at the current levels. Hence, a ‘Sell’ recommendation is given on the stock at the current price of AUD 17.745 (as of May 10, 2024, at 11:25 AM AEST).
Markets are trading in a highly volatile zone currently due to certain macro-economic issues and geopolitical issues prevailing geopolitical tensions. Therefore, it is prudent to follow a cautious approach while investing.
Note 1: Past performance is neither an indicator nor a guarantee of future performance.
Note 2: The reference date for all price data, currency, technical indicators, support, and resistance levels is 10 May 2024. The reference data in this report has been partly sourced from REFINITIV.
Note 3: Investment decisions should be made depending on an individual's appetite for upside potential, risks, holding duration, and any previous holdings. An 'Exit' from the stock can be considered if the Target Price mentioned as per the Valuation and or the technical levels provided has been achieved and is subject to the factors discussed above.
Technical Indicators Defined: -
Support: A level at which the stock prices tend to find support if they are falling, and downtrend may take a pause backed by demand or buying interest.
Resistance: A level at which the stock prices tend to find resistance when they are rising, and uptrend may take a pause due to profit booking or selling interest.
Stop-loss: In general, it is a level to protect further losses in case of any unfavourable movement in the stock prices.
AU


 Please wait processing your request...