This report is an updated version of the report published on the 31 January 2024 at 3:55 PM AEDT.

CSL Limited (ASX: CSL)
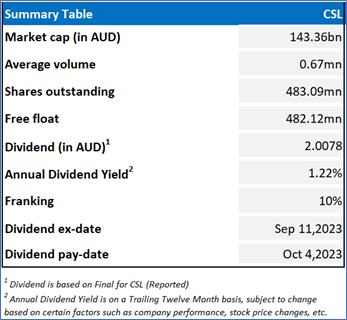
CSL is engaged in the research, development, manufacturing, marketing and distribution of biopharmaceutical products and vaccines. The ASX-listed biotechnology company includes three businesses, CSL Behring, CSL Seqirus and CSL Vifor.
Recommendation Rationale – SELL at AUD 302.50
- Financial Performance: FY23 was marked by performance across all of the businesses. Revenue jumped 26% YoY backed by factors such as a double-digit jump in immunoglobulin (Ig) product sales. Underlying profit went up by 20% YoY on a constant currency basis. The period saw record plasma collections.
- Outlook: For FY24, revenue growth is expected at ~9-11% YoY and NPATA is expected to grow 13-17% YoY to USD 2.9-3.0bn at constant currency. Focus remains on advancing the company’s R&D pipeline.
- Emerging Risks: Any disruption to the supply of raw materials, software and bespoke manufacturing equipment may potentially impact the company’s operations. Changing the competitive landscape for new technologies and disruptive therapies can have an impact on the demand for the company’s products.
- Overvalued Multiples: On a forward 12-month basis, key valuation multiples (EV/EBITDA, EV/Sales, Price/Cash Flow, Price/Book, and Price/Earnings) are higher than the median of the Healthcare’ industry.
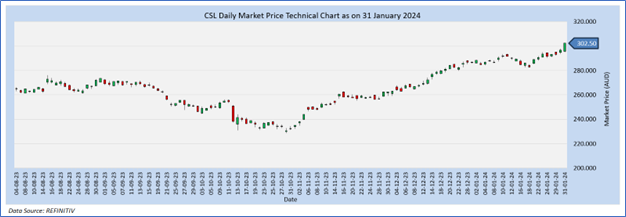
CSL Daily Chart

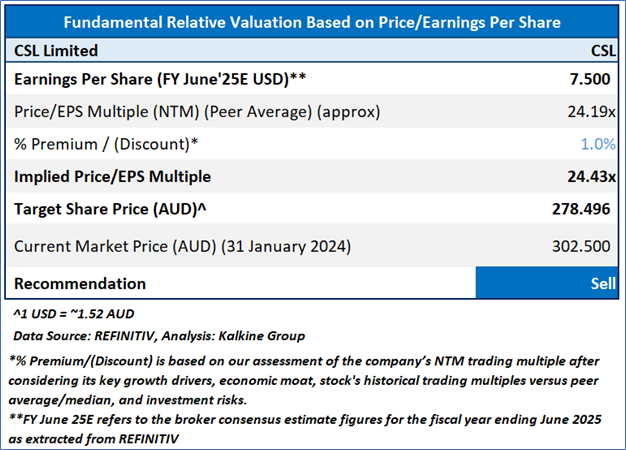
Valuation Methodology: Price/Earnings Approach (FY June'25E) (Illustrative)

Stock might trade at a slight premium to its peers, considering record plasma collections, the company’s cluster of R&D programs nearing completion, and other factors. For valuation, few peers like Ramsay Health Care Ltd (ASX: RHC), Resmed Inc (ASX: RMD), Sonic Healthcare Ltd (ASX: SHL), and others have been considered. Considering the current trading levels and risks associated, downside indicated by the valuation, it is prudent to book profit at the current levels. Hence, a ‘Sell’ recommendation is given on the stock at the current price of AUD 302.50 (as of January 31, 2024, at 3:45 PM AEDT).
Markets are trading in a highly volatile zone currently due to certain macro-economic issues and geopolitical issues prevailing geopolitical tensions. Therefore, it is prudent to follow a cautious approach while investing.
Note 1: Past performance is neither an indicator nor a guarantee of future performance.
Note 2: The reference date for all price data, currency, technical indicators, support, and resistance levels is 31 January 2024. The reference data in this report has been partly sourced from REFINITIV.
Note 3: Investment decisions should be made depending on an individual's appetite for upside potential, risks, holding duration, and any previous holdings. An 'Exit' from the stock can be considered if the Target Price mentioned as per the Valuation and or the technical levels provided has been achieved and is subject to the factors discussed above.
Note 4: Dividend Yield may vary as per the stock price movement.
Technical Indicators Defined: -
Support: A level at which the stock prices tend to find support if they are falling, and downtrend may take a pause backed by demand or buying interest.
Resistance: A level at which the stock prices tend to find resistance when they are rising, and uptrend may take a pause due to profit booking or selling interest.
Stop-loss: In general, it is a level to protect further losses in case of any unfavourable movement in the stock prices.
AU


 Please wait processing your request...