Callon Petroleum Company
.png)
CPE Details
CPE Commences Exchange Offer: Callon Petroleum Company (NYSE: CPE) is mainly engaged in the exploration, and production of oil and gas resources in the Permian Basin. On May 11, 2020, the company stated that it has begun a private exchange offering of its 6.25% Senior Notes due 2023, its 8.25% Senior Notes due 2025, 6.125% Senior Notes due 2024 and 6.375% Senior Notes due 2026 to each Eligible Holder, in exchange of their Old Notes for up to $300,000,000 aggregate principal amount. The newly issued Second Lien Senior Secured Notes carries an interest rate of 8.00% and is due in 2025. Each case is subject to fulfilment of the terms and conditions applicable.
1QFY20 Key Highlights for the Period Ended 31 March 2020: During the quarter, the company reported adjusted earnings of 12 cents per share as compared to 16 cents reported in the year-ago quarter. The decrease in earnings was due to lower natural gas and oil price realizations along with elevated operating costs. This was, however, offset partially by increased production volumes. The company reported operating revenues of $289.9 million, up from the year-ago figure of $153 million. Net production volumes during the quarter, averaged 100,955 barrels of oil equivalent per day (Boe/d), as compared to 40,311 Boe/d reported in 1QFY19. Improved volumes were due to operations in the Permian Basin and Eagle Ford Shale. Oil as a percentage of total daily production stood at 64%. During the quarter, the company reportedtotal operating expenses of $242.1 million, up from $109.9 million reported in 1QFY19. Nonetheless, lease operating expenses declined from $6.63 a year ago to $5.70 per Boe in the reported quarter. The company exited the period with total cash and cash equivalents of $14.8 million, and long-term debt amounted to $3.2 billion.
.png)
1QFY20 Key Highlight (Source: Company Reports)
Outlook: The company ceased from providing the outlook for FY20 in the wake of the COVID-19 pandemic. Nevertheless, it did issue some forecasts to give investors certain insights. In the June quarter, production is expected to be greater than 105 Mboe/d. For FY20, the company’s oil production is expected to be flat or more than its volumes recorded in the March quarter. OPEX for the remaining nine months of FY20 is likely to be between $250-$235 million. For the remainder of this year, CPE predicts free cash flow to be in the range of $25-$100 million. However, the company’s forecast is reliant on the average WTI oil price, which is believed to lie within $25-$30 per Bbl during the period.
Growth Impetus: The energy sector is again back on the track. The recent completion of the crude production cut deal extension by OPEC and its partners has applauded energy investors since the commodity market is oversupplied. Since people are now resuming to work, fuel demand might continue to improve, going forward.
Risk Analysis: On the flip side, rising expenses is likely to hurt the company’s profit margin in the coming quarters. Further, low cash balance and high debt load are reflecting from the weak point in the company’s financial flexibility, which can affect its growth projects. Further, volatile commodity prices add to the concerns.
Valuation Methodology: EV/EBITDA Multiple Based Relative Valuation (Illustrative)
.png)
EV/EBITDA Multiple Based Relative Valuation (Source: Refinitiv, Thomson Reuters)
Note: All forecasted figures have been taken from Thomson Reuters, NTM: Next Twelve Months
Stock Recommendation: The stock of CPE closed at $1.62 with a market capitalization of ~$643.1 million. The stock made a 52-week low and high of $0.38 and $7.01 and is currently trading at the lower band of its 52-week trading range. The stock has run up ~118.89% and ~129.05% in the last one month and three months, respectively. Notably, in Mar’ FY20, the company’s debt to equity ratio stood at $0.94x, higher than the industry median of $0.79x. Considering the aforesaid facts and current trading levels, we have valued the stock using an EV/EBITDA multiple based illustrative relative valuation method. We have considered peers like Diamondback Energy Inc (NASDAQ: FANG), PDC Energy Inc (NASDAQ: PDCE), and SM Energy Co (NYSE: SM), and arrived at a target price of limited upside (in % terms). Hence, we have a watch stance on the stock at the closing price of $1.62, up 6.58% as on 16 June 2020.
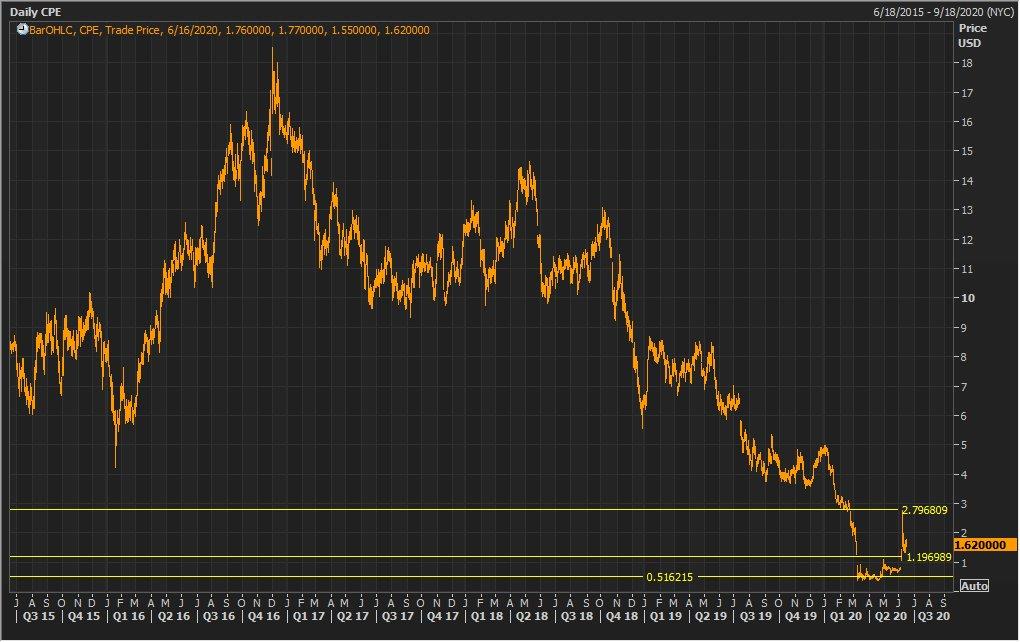
CPE Daily Technical Chart (Source: Refinitiv, Thomson Reuters)
Disclaimer
The advice given by Kalkine Pty Ltd and provided on this website is general information only and it does not take into account your investment objectives, financial situation or needs. You should therefore consider whether the advice is appropriate to your investment objectives, financial situation and needs before acting upon it. You should seek advice from a financial adviser, stockbroker or other professional (including taxation and legal advice) as necessary before acting on any advice. Not all investments are appropriate for all people. Kalkine.com.au and associated pages are published by Kalkine Pty Ltd ABN 34 154 808 312 (Australian Financial Services License Number 425376). The information on this website has been prepared from a wide variety of sources, which Kalkine Pty Ltd, to the best of its knowledge and belief, considers accurate. You should make your own enquiries about any investments and we strongly suggest you seek advice before acting upon any recommendation. Kalkine Pty Ltd has made every effort to ensure the reliability of information contained in its newsletters and websites. All information represents our views at the date of publication and may change without notice. To the extent permitted by law, Kalkine Pty Ltd excludes all liability for any loss or damage arising from the use of this website and any information published (including any indirect or consequential loss, any data loss or data corruption). If the law prohibits this exclusion, Kalkine Pty Ltd hereby limits its liability, to the extent permitted by law to the resupply of services. There may be a product disclosure statement or other offer document for the securities and financial products we write about in Kalkine Reports. You should obtain a copy of the product disclosure statement or offer document before making any decision about whether to acquire the security or product. The link to our Terms & Conditions has been provided please go through them and also have a read of the Financial Services Guide. On the date of publishing this report (mentioned on the website), employees and/or associates of Kalkine Pty Ltd do not hold positions in any of the stocks covered on the website. These stocks can change any time and readers of the reports should not consider these stocks as personalised advice.
 AU
AU

 Please wait processing your request...